Article Text

Abstract
Objectives Vascular cognitive impairment (VCI) is a heterogeneous group of cerebrovascular diseases secondary to large and small vessel disease. We hypothesised that biomarkers obtained early in the disease could identify a homogeneous subpopulation with small vessel disease.
Methods We obtained disease markers in 62 patients with VCI that included neurological findings, neuropsychological tests, multimodal MR and cerebrospinal fluid measurements of albumin ratio, matrix metalloproteinases (MMPs), amyloid-β1–42 and phosphorylated-τ181. Proton MR spectroscopic imaging showed ischaemic white matter and permeability of the blood-brain barrier (BBB) was measured with dynamic contrast-enhanced MRI. We constructed a 10-point Binswanger disease score (BDS) with subjective and objective disease markers. In addition, an objective set of biomarkers was used for an exploratory factor analysis (EFA) to select patients with BD. Patients were followed for an average of 2 years to obtain clinical consensus diagnoses.
Results An initial BDS of 6 or greater was significantly correlated with a final diagnosis of BD (p<0.05; area under the curve (AUC)=0.79). EFA reduced nine objective biomarkers to four factors. The most predictive of BD was the factor containing the inflammatory biomarkers of increased BBB permeability, elevated albumin index and reduced MMP-2 index (factor 2; AUC=0.78). Both measures independently predicted a diagnosis of BD, and combining them improved the diagnostic accuracy.
Conclusions Biomarkers predicted the diagnosis of the BD type of subcortical ischaemic vascular disease. Using pathophysiological biomarkers to select homogeneous groups of patients needs to be tested in targeted treatment trials.
- BLOOD-BRAIN BARRIER
- CEREBROVASCULAR DISEASE
- VASCULAR DEMENTIA
- CSF
- COGNITION
Statistics from Altmetric.com
Introduction
Vascular cognitive impairment (VCI) is the second leading cause of dementia in the elderly, and a major factor in the progression of Alzheimer's disease (AD).1–3 Both large and small vessel disease (SVD) cause VCI, and the heterogeneity has impeded clinical trials. SVD or subcortical ischaemic vascular disease (SIVD) is generally progressive, while large vessel disease, due to either major vessel thrombosis or emboli, occurs in an unpredictable pattern, making SIVD the optimal form for treatment trials.4 ,5 SIVD of the Binswanger disease (BD) type is characterised by extensive involvement of the white matter (WM) with neuropsychological abnormalities primarily in executive function and focal neurological signs.6 ,7 Differentiation of BD from other forms of neurodegeneration is often difficult and disease markers have been used to facilitate early diagnosis; they should appear in the early stages and be validated by long-term follow-up. There are a number of potential biomarkers to aid diagnosis of SIVD of the BD type, including WM hyperintensities (WMHs) on MRI,8 metabolite levels with proton MR spectroscopic imaging (1H-MRSI),9–12 quantification of blood-brain barrier (BBB) permeability,13 ,14 executive dysfunction on neuropsychological testing,15 and elevated albumin ratio and matrix metalloproteinases (MMPs) in the cerebrospinal fluid (CSF).16–19 However, used individually none of the biomarkers can reliably diagnose SIVD. Therefore, we hypothesised that combining clinical, imaging and CSF studies would provide greater diagnostic accuracy, particularly at an early stage when treatments are most likely to be beneficial. To test the hypothesis, we obtained biomarkers at entry to the study and compared them with diagnoses made after multiyear follow-up.
Patients and methods
From 2006 to 2010, we recruited 62 patients with suspected VCI. Patients were seen in the Neurology Clinics at University of New Mexico Hospital and Albuquerque Veterans Medical Center. A battery of neuropsychological tests was performed at entry. All patients had a clinical MRI as part of their regular medical care. Additional research-related MR studies were performed, including 1H-MRS and dynamic contrast-enhanced MRI (DCEMRI). Patients underwent lumbar puncture to obtain CSF for routine clinical studies, including demyelinating panel, and measurement of albumin ratio and MMPs. Blood was drawn to calculate CSF/serum indexes. At yearly intervals, patients underwent repeat neurological and neuropsychological testing. A test of competency was performed to assure that patients understood and consented to all study procedures, including lumbar puncture. The University of New Mexico Human Research Review Committee approved the study.
Clinical consensus diagnoses were made after multiple years follow-up without knowledge of the results of the biomarker studies. They were based on clinical information concerning disease progression, the initial and subsequent neurological examinations, and the clinical MRI. We used these clinical diagnoses for comparison with the biomarkers obtained at the time of entry. Clinical diagnoses were one of four categories: (1) multiple infarctions or single strategic stroke (MI) for patients with cortical strokes on MRI; we included lacunes limited to the thalamus or basal ganglia without WM lesions in this category; (2) mixed dementia (MX) in those suspected to have both VCI and AD; (3) SIVD of BD type for those with prominent WM involvement suspected to be due to vascular disease and (4) leucoaraiosis (LA) in patients with WMHs, but in whom a consensus diagnosis could not be made and the cause of the changes on the MRI were of unknown aetiology at the time of consensus evaluation.20
Neuropsychological test batteries
Cognitive tests were administered by a trained research psychologist (JP) and scored according to standard procedures. Standardised (T) scores were calculated for each test. Averaged composite T-scores were calculated for four cognitive domains: memory, executive function, attention and language. Tests for each domain included: memory (Hopkins Verbal Learning Test-Delay, Rey Complex Figure Test-Long Delay), executive function (Digit Span Backwards, Trail Making Test B, Wisconsin Card Sorting-Total errors), attention (Digit Span Forward, and Trial Making Test A) and language (Boston Naming 60 item test, Controlled Oral Word Association (FAS)). An overall cognitive composite score was derived as the mean of individual domain T-scores. Control participants for the MRI studies underwent the same neuropsychological test battery.
MR studies
1H-MRSI acquisition
1H-MRSI was performed with a phase-encoded version of a point-resolved spectroscopy sequence with or without water presaturation (TR/TE=1500/135 ms, FOV=220×220 mm, slice thickness=15 mm, circular k-space sampling (radius=24), total scan time=9 min 42 s).12 The WM concentrations of total N-acetyl-containing compounds (NAA and N-acetylglutamylaspartate referred as NAA), choline-containing metabolites (CHO) and creatine+phosphocreatine (CR) are reported.
Dynamic contrast-enhanced MRI
MR BBB measurements were performed with the contrast agent gadolinium-diethylenetriaminepentaacetic acid (Gd-DTPA; Magnevist, Bayer Corp). The BBB measurement was based on a time series of eight T1 maps acquired with a fast T1 mapping sequence with partial inversion recovery.13 A T1 map was acquired before Gd-DTPA injection and the rest were sampled postinjection resulting in a two-dimensional time series data set of MRIs. Plasma levels of Gd-DTPA that are used in the graphical method of permeability calculation were sampled from the sagittal sinus, and they were used as a surrogate measure of Gd-DTPA concentration in the vascular compartment. Gd-DTPA was injected by pump as a rapid intravenous bolus. Using time series data, we calculated the rate at which the contrast agent passed from the vascular compartment into the tissue compartment, Ki, using the Patlak graphical method of parameter estimation of WM permeability.21 Pooled data from healthy control participants was obtained from 20 individuals, ranging in age from 22 to 80 years (mean±SEM of 44±4 years).
Biomarkers in CSF and blood
Gelatin-substrate zymography of CSF and plasma
CSF and blood were sent to the clinical laboratory for measurements of albumin and multiple sclerosis panel. The levels of MMP-2 and MMP-9 were measured in the CSF and plasma by gelatin-substrate zymography.18 The levels of albumin in the serum and CSF were used to form an index of the MMP-2 and MMP-9 in each compartment in order to determine intrathecal protein production from blood-derived proteins, using the methods developed for IgG index in multiple sclerosis.22 Normally, MMP-2 is found in the CSF, making it difficult to detect small changes in its concentration. Furthermore, when the BBB is disrupted, MMPs from the systemic circulation may enter the brain, thus adding to the levels in the CSF. To correct for the contribution of MMPs from the blood, we formed an MMP index: (MMPcsf/albuminCSF)/(MMPblood/albuminblood). Correcting for albumin transport allows for the calculation of endogenous MMP production.
AD proteins: Aβ42 and P-τ181
Measurements of AD proteins, amyloid-β1–42 (Aβ42), total-τ and phosphorylated-τ181 (P-τ181) were made using assay kits (INNO-BIA AlzBio3, Innogenetics, Gent, Belgium) with the LUMINEX instrument (Worldwide Clinical Trials, Austin Texas, USA) in a laboratory that was part of the AD consortium.
Statistical analysis
BD score
We used a combination of clinical, imaging and CSF studies as disease markers of patients with VCI. Our goal was to identify specific patients with clinical symptoms possibly related to neuroinflammation with BBB disruption and WM changes. Multiple factors were combined since none of the clinical or imaging features alone were sufficient. A 10-point score was formed from clinical, multimodal imaging and CSF results. Each patient's BD score (BDS) was calculated based on the number of scale components collected, which minimised any bias for missing scale component values.
Principal component analysis and exploratory factor analysis
As a second independent approach to calculate a score for BD, we used principal component analysis (PCA) and exploratory factor analysis (EFA) with nine biomarkers to obtain the dominant factors, which included average T-score for executive tests, levels of three metabolites (NAA, CHO and CR), albumin ratio, MMP-2 and MMP-9 indexes, Aβ42/logP-τ181, and mean BBB permeability from DCEMRI.
Four factors emerged from this analysis that can be considered a distinct scale on its own. The EFA uses the correlation matrix of the variables, and to perform optimally, required variables with an approximately normal distribution. To achieve this, we log-transformed several variables. A correlation matrix based on ‘pairwise complete’ observations was used to compensate for missing values. An initial PCA indicated that four variables could account for any noticeable variance in the data. Using four variables to avoid missing possible patterns, we identified from the EFA the ‘loading’ patterns defining the new factors.
Comparison of entry BDS and EFA with final diagnoses
Receiver operator characteristic (ROC) curves were constructed using logistic regression analysis with BDS and factor scores (separately) as predictors and final diagnosis of BD as the outcome variable. Cut-points were found for BDS and factor scores from the ROC curves. Fisher's exact test compared BD to other diagnoses with respect to numbers above the BDS cut-point. Similar analysis was performed for the EFA probability scores from the logistic regression. Finally, the patients were grouped into those concordant for high and low BDS and EFA scores with an intermediate group of discordant patients.
Results
Clinical diagnoses after long-term follow-up
Sixty-two patients were enrolled in the study. We excluded 10 participants: two patients were excluded because they could not complete the MRI studies; four patients had WMHs that remained stable or improved after an episode of hypoxic hypoperfusion; one was found to have WMHs due to B12 deficiency; one had a strong family history of Sneddon's syndrome but had no WMHs when studied; one had WMHs that were unchanged over 10 years; and one had biopsy proven polysaccharide storage myopathy with WMHs of unknown aetiology. Final diagnoses in the 52 patients were the following: SIVD of the BD type in 25, mixed AD/VCI in 5, multiple infarcts or single strategic infarcts in the basal ganglia in 9, and LA in 13. Table 1 shows the clinical features of the patients separated into final disease categories.
Clinical factors for the patients based on clinical consensus diagnoses separated into the four major diagnostic categories
BDS (model I)
Two models were tested for correlation of disease markers with final diagnosis. In model I, we selected 10 disease markers obtained at study entry for inclusion in the BDS, and in model II, we used PCA and EFA with quantitative biomarkers only to calculate a probability score for having a diagnosis of BD. In the BDS model, points were given for each clinical feature present, and cut-points were used to assign points for continuous variables (table 2). To determine the correspondence of the final diagnoses with the BDS obtained at entry, we divided patients into two groups: less than six and greater than or equal to six (table 3). There were no between-group differences for age, diabetes or Aβ42/logP-τ181. However, hypertension, gait abnormalities, albumin ratio, MMP-2 index and mean permeability were statistically greater in the group with higher BDSs. Executive function T-scale scores were significantly lower.
Components of the scoring system used to select patients most likely to have BD
Individual clinical components that were used to separate patients based on subcortical ischaemic vascular disease scores (BDS)
We compared patients with BD to the other diagnostic categories to test individual biomarkers. Significant differences were found for albumin ratio, NAA, MMP-2 index and mean permeability determined by DCEMRI (figure 1).

Comparison of individual biomarkers between patients with Binswanger ‘s disease (BD) and non-BD, including multiple infarcts (MI), mixed Alzheimer's disease/vascular cognitive impairment (MX), leucoaraiosis (LA). (A) Albumin index (ratio of cerebrospinal fluid albumin to serum albumin) shows significant elevation in BD, suggesting disruption of the blood-brain barrier. (B) N-acetylaspartate (NAA) measured in white matter by proton magnetic resonance spectroscopy (1H-MRS) was significantly lower in BD due to ischaemic injury to the white matter. (C) Matrix metalloproteinase-2 (MMP-2) index was significantly reduced in BD. (D) Mean blood-brain barrier permeability, Ki, measured by dynamic contrast-enhanced MRI was elevated in BD. Numbers in parentheses represent statistical significance.
PCA and EFA (model II)
PCA indicated that four variables represented a reasonable number of dimensions; the scree plot showed that no more than four variables would be necessary. Therefore, four variables were chosen to avoid missing possible patterns. EFA identified four factors that contained several of the variables in each cluster. Although there is nothing unique about these particular factors and others would work similarly, these are the best that fit the definition of BD by the selected criteria.
Table 4 contains factor loadings for each of the four factors. CR dominates components of factor 1 with slightly less but equal contributions from executive function, NAA and CHO. All signs are positive, so large values of factor 1 come from large values of all four variables. Albumin ratio dominates factor 2 with a lesser contributions from logMMP-2 index and BBB permeability (mean Ki). The logMMP-2 index has the opposite sign to the other variables, so large values come from high albumin ratio and permeability, but low MMP-2 index. Factor 3 is almost all logMMP-9 index with less contribution from permeability. Both signs are the same. Factor 4 is mostly Aβ42/logP-τ181 with much smaller contributions from NAA and CHO as well as executive T-scores, which contribute in the opposite direction to the others.
Exploratory factor analysis for nine biomarkers identifying four factors with the contribution of each biomarker to that factor shown
Assignment of factor scores to individual patients
Next we assigned factor scores to each participant with the loadings above applied to the z-scores of variables. Missing values were imputed for a participant by assigning the mean value of other participants for the missing value (assigned a z-score of 0 for that value). Without imputing missing values, it is not possible to get factor scores for participants who have any missing values for any of the variables. We then looked at how the factor scores varied by diagnosis. Factor 2 behaved the most efficiently as a marker for BD. MX and BD are relatively low on factors 1 and 4, but factor 2 best discriminates BD from MX and the other diagnoses. Factor 3 did little to separate diagnostic groupings. The EFA, using a cut-point of 0.4, predicted the final clinical diagnosis in 88% of the patients with BD (figure 2).

Number of patients identified as BD using the two scores. (A) Number of patients with BD score (BDS) of 6 or greater for those with a diagnosis of BD compared with those with other diagnoses (MI/MX/LA). Fisher's exact test showed a significance of p=0.01. (B) Similar analysis using the exploratory factor analysis with estimated probability of BD (p^)( ) determined by logistic regression of the four factors (see text). Uses a cut-point of (p^) ≥0.4
 selected by examining the ROC curve. Significance with Fisher's exact test of p<0.0001. BD, Binswanger's disease; BDS, Binswanger's disease score; MI, multiple infarcts; MX, mixed dementia; LA, leucoaraiosis; EFA, explanatory factor analysis; ROC, receiver operating characteristic.
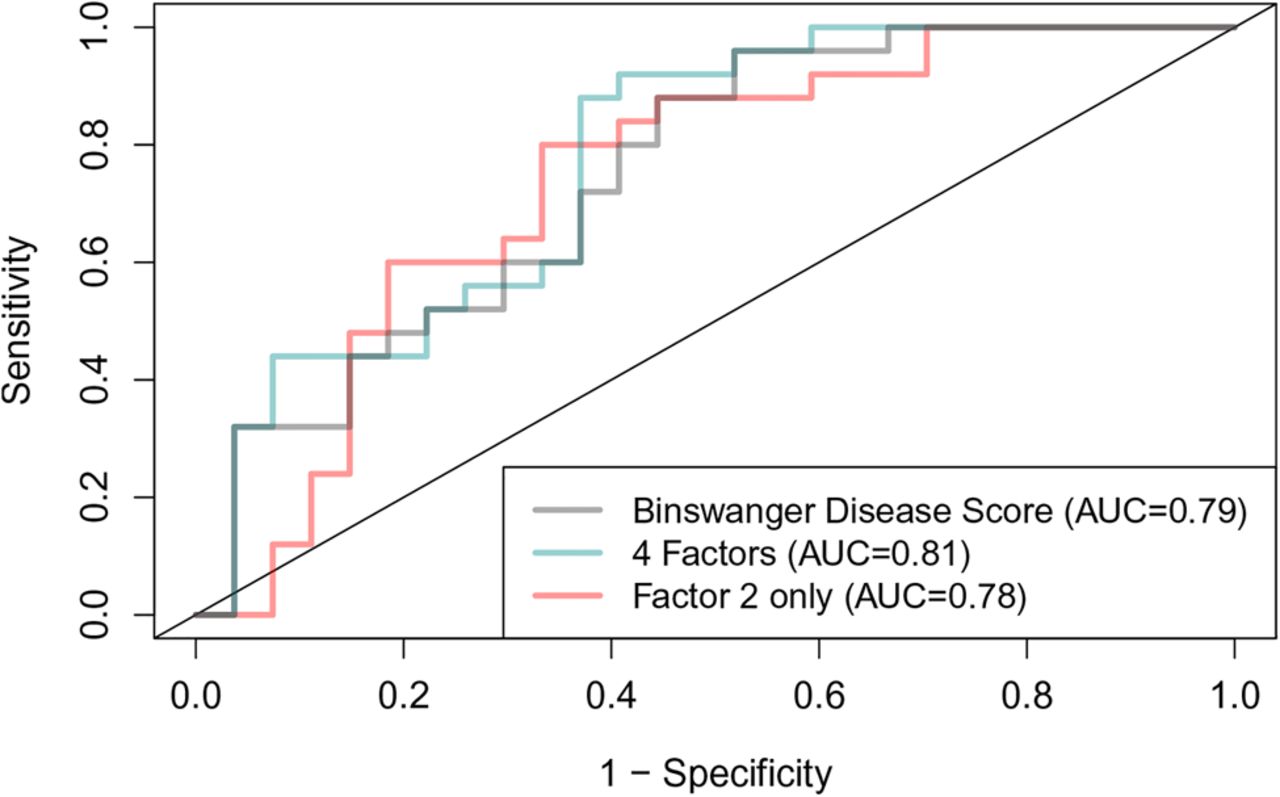
ROC comparison of EFA biomarker analysis compared to BDS feature selection
Both the EFA clustering and the BDS feature list separated BD from the other patients with a high level of statistical certainty. ROCs were constructed for BDS (area under the curve (AUC) −0.79) and for EFA, using all four factors (AUC −0.81) and factor 2 alone (AUC=0.78); all of the measures provided a high level of statistical accuracy (figure 3).

Receiver operating characteristic (ROC) curves for the different scores. Gray line shows Binswanger Disease Score with area under the curve (AUC) shown. The four exploratory factor analysis factors gave an AUC of 0.81, and factor 2 had an AUC of 0.78.
Comparing both BDS and EFA with diagnoses
Patients were separated into three groups based on the values of the BDS and EFA. Using a cut-point for BDS of 6 or greater to designate BD and an EFA probability score of greater than 0.4 to indicate BD, we found 21 patients concordant for both (see online supplementary table S1). One or the other score was elevated in 16 patients, and 15 patients had both scores below the cut-points (see online supplementary tables S2 and S3, respectively). Patients were followed for an average of 1–2 years. In those in which repeat neuropsychological testing was available, we found that 43% of group 1 patients declined or had died, while only 19% had a similar response in group 3. In group 1, 73% had a diagnosis of BD, compared with only 13% in group 3 (table 5).
Summary of results for both BDS and probability (p^) in each group
Discussion
Disease markers improve diagnostic accuracy, but no single disease marker is ideal for selecting patients with BD. Therefore, in this study, we combined several disease markers based on clinical history, physical examination, neuropsychological test scores, multimodal MRI and CSF analysis. A key feature of this approach was that we obtained the clinical and biomarker data at entry into the study, and compared the initial findings with subsequent diagnoses made after multiyear follow-up, which was necessary because the length of the illness limited the number of autopsies. We used two methods to compare the initial data set with subsequent diagnoses with the goal of obtaining a set of disease markers that could predict the clinical diagnosis. The first method was to construct a 10-point BDS that included results of several disease markers obtained from clinical, neuropsychological, MR modalities and CSF testing; when the BDS was greater than 6, BD was most likely. The second method used PCA/EFA based on nine objective biomarkers to calculate a probability of a diagnosis of BD. We identified a subgroup of about one-third of patients with VCI with both a high BDS and elevated probability based on the EFA; this group had a high likelihood of having a final diagnosis of BD. Patients with presumed inflammatory-mediated BBB disruption constitute a smaller, more homogeneous cohort for clinical studies that could be done with fewer participants, increasing the chance of performing well-powered clinical trials in VCI.
VCI is a major cause of dementia by itself and when combined with AD accelerates the dementia.2 ,3 In spite of the importance of VCI, few clinical trials have been reported because of the heterogeneity of VCI pathology, which includes both large vessel disease that occurs in a random fashion, and progressive SVD, which is considered the most prevalent and the optimal group for treatment trials.5 ,23 We divided patients with SIVD into those with lacunes isolated to the basal ganglia, which were considered multiple strokes or single strategic strokes, and those with WMHs that may or may not also have lacunes in the basal ganglia. Extensive damage to the WM associated with arteriolosclerosis was first described by Otto Binswanger in 1892.24 This is a slowly progressive form of VCI that overlaps with other neurodegenerative disorders, making clinical diagnosis difficult.
The nine biomarkers used in the EFA clustered into four major factors. Statistical analysis showed that factor 2, which contained albumin ratio, MMP-2 index and permeability of the BBB, namely the neuroinflammatory biomarkers, most closely aligned with the clinical diagnosis of BD. Factor 1 was composed of 1H-MRSI (NAA, CHO and CR) and the executive function test scores; this corresponds to an earlier report where we found the levels of NAA and CR in the WM were both separately highly correlated with executive function, while volume of the WMHs failed to show a relationship with either of the biomarkers of WM injury.12 Factors 3 and 4, which were elevated MMP-9 index and normal Aβ42/logP-τ181, respectively, were less useful in selecting the patients with BD.
BDS contained both the main clinical disease markers and biomarker features of BD, while only objective biomarkers were used in the calculation of EFA. Both the BDS and the EFA were able to predict subsequent diagnoses. We found that 78% of patients with a BDS of 6 or greater had a clinical diagnosis of BD. Similarly, the EFA cut-point of 0.4 included 88% of the patients with BD. Thus, using the biomarker approach, we identified selection criteria that could be used for subgroup analysis of patients with VCI.
Several pathological processes could explain the progressive, often symmetric involvement of the WM. One possible mechanism is vasogenic oedema secondary to hypoxia. Hypoxia-inducible factor-1α has been detected in patients with VCI at autopsy.25 Bilateral carotid occlusion in normotensive rats causes MMP-mediated opening of the BBB in WM with vasogenic oedema.26 ,27 Spontaneously hypertensive stroke prone rats show hypoxia in the WM when measured directly with electron paramagnetic resonance spectroscopy.28 Another possible pathophysiology is isolated thrombotic lesions, leading to the lacunes that are often seen in WM related to SVD, which have been shown to be contrast enhancing with MRI.29
Other investigators and we have described abnormal levels of MMPs in the CSF of patients with VCI.17–19 MMPs are a family of 26 extracellular matrix-degrading enzymes that attack the basal lamina and tight junctions of the cerebral endothelial cells, opening the BBB; they have been identified in pathological tissues from animal models of VCI and in human tissues.30–32 The MMPs have two major functions in inflammation: they open the BBB and breakdown myelin.33–35 Elevated levels of albumin in CSF along with several other proteins, including neurofilament light and myelin basic protein, are found in the CSF in patients with VCI.19 ,36 The presence of albumin, MMPs and fragments of myelinated fibres suggests an inflammatory process contributes to the pathophysiology of VCI.
There are several caveats in the use of biomarkers to identify patients with VCI with neuroinflammation, relating them to the clinical diagnosis. We used an ‘a priori’ set of features to define the patients with BD in constructing the BDS. These features were obtained from the literature and included both clinical findings and biomarkers. Within that group of features, those associated with an inflammatory process leading to BBB disruption were the dominant factors. This novel approach enabled an early diagnosis to be made rather than having to wait several years to more firmly establish the diagnosis. Furthermore, autopsy confirmation is rarely available and the number of neurodegenerative processes found at autopsy obscure the initial pathological process.37 Another problem was that we intensively studied a small number of patients, and a larger prospective study will be required to verify the biomarkers selected. Finally, we recognise the circularity in the use of biomarkers selected that were used in the definition. The uniqueness of this approach was the use of biomarkers that demonstrated the underlying pathophysiology, and which could be used to inform selection of therapeutic targets for trials based on objective findings.
In conclusion, we used a combination of clinical findings and multimodal disease markers to separate a subset of patients with VCI. We used statistical methods to linearly combine biomarkers into groups of four factors, which provided a high level of predictability for biomarkers, obtained at the entry, to map to the diagnoses determined after long-term follow-up. The importance of our finding of a small number of neuroinflammatory biomarkers, using multimodal imaging and CSF biochemistry, is that it is now possible to study a more homogeneous cohort of patients with VCI and to test the ability of agents targeting the neuroinflammatory response with measures of BBB permeability, neuropsychological testing and CSF biomarkers as outcome measures to track response to treatment.
Acknowledgments
Supported by grants from the NIH (RO1 NS052305-08) and from the US-Israel Biennial Foundation to GAR, and by the National Center for Research Resources and the National Center for Advancing Translational Sciences of the NIH through Grant Number 8UL1TR000041, UNM Clinical and Translational Science Center.
References
Supplementary materials
Supplementary Data
This web only file has been produced by the BMJ Publishing Group from an electronic file supplied by the author(s) and has not been edited for content.
Files in this Data Supplement:
- Data supplement 1 - Online supplement
Footnotes
Contributors GAR designed the study, identified patients, obtained the funding and wrote the first draft. JP was the research coordinator; she recruited patients, did the neuropsychological testing, and participated in the manuscript preparation. JA, BNH and JK were clinical neurologists involved in patient recruitment, neurological examinations, lumbar puncture and manuscript preparation. AC and CG performed the NMR studies and manuscript preparation. JT provided technical assistance with the image analysis, CSF studies, data analysis and manuscript preparation. RS was the statistician involved in the study design and played a major role in statistical analysis and manuscript preparation. EBE provided assistance with the interpretation of the statistical analysis and reviewed and commented on the manuscript. William Nowatzke kindly performed the amyloid and τ assays at Worldwide Clinical Trials, Austin, Texas, USA.
Competing interests None.
Patient consent Obtained.
Ethics approval University of New Mexico Human Research Review Committee.
Provenance and peer review Not commissioned; externally peer reviewed.
Data sharing statement The authors have tables containing all of the patient data separated by biomarkers. These are available to individuals that are interested in seeing them.