Article Text

Abstract
Aims To assess the functional and clinical outcome in a sizeable cohort of patients with osmotic demyelination syndrome (ODS) and to characterise the factors which could predict the final outcome.
Methods Twenty five consecutive patients with ODS formed the study cohort. The diagnosis of ODS was based on clinical features with corroborating imaging findings. Two functional scales—Functional Independent Measure (FIM) and Disability Rating Scale (DRS)—were applied to assess the functional status at the time of admission, discharge and last follow-up. Patients who became independent for activities of daily living (ADL) at last follow-up were classified as favourable outcome, and those who died or became dependent for ADL were classified as a poor outcome group respectively. The Fisher exact test and Mann–Whitney U test were used to assess categorical and continuous variables respectively.
Results The mean age at diagnosis was 53±14 years. Five (20%) had central pontine myelinolysis, seven (28%) had extrapontine myelinolysis, and 13 (52%) had both. Hyponatraemia and hypokalaemia were noted in 20 (80%) and 10 (40%) patients respectively. Six (24%) received intravenous methylprednisolone. Eleven (46%) had a favourable outcome at a mean follow-up of 2.2±2.5 years. Hyponatraemia ≤115 mEq (p=0.04), associated hypokalaemia (p=0.04) and low Glasgow Coma Scale (GCS) (p=0.008) at presentation were predictive of poor outcome. The mean FIM score at admission (p=0.05) and at discharge (p=0.01), and mean DRS at admission (p=0.05) were predictive of poor outcome.
Conclusions Higher GCS scores, better scores in functional scales in hospital, less severe hyponatraemia and absence of superadded hypokalaemia predicted favourable outcome.
- Osmotic demyelination syndrome
- central pontine myelinolysis
- outcome
- prognostic factors
- functional scales
- clinical neurology
- myelin
Statistics from Altmetric.com
- Osmotic demyelination syndrome
- central pontine myelinolysis
- outcome
- prognostic factors
- functional scales
- clinical neurology
- myelin
Introduction
The osmotic demyelination syndrome (ODS) is an uncommon disorder, characterised by non-inflammatory demyelination involving the pons and other areas of the central nervous system.1–3 It comprises central pontine myelinolysis (CPM) and extrapontine myelinolysis (EPM). The usual predisposing factors are chronic alcoholism, malnutrition and rapid correction of hyponatraemia.1–3 Although the exact pathogenesis is unknown, the most widely accepted hypothesis is that cellular oedema secondary to the fluctuating osmotic forces, especially with the rapid and overcorrection of hyponatraemia, results in fibre-tract compression and demyelination. These changes are more common in the areas of the CNS where a compact admixture of white and grey mater is present, as in the pons and basal ganglia.2 3 Clinical manifestations are variable and depend on the region(s) of the brain involved. The classical clinical presentation of ODS is the evolution of a locked in state and/or various movement disorders after a brief period of recovery from encephalopathy.2 3 Some cases may be asymptomatic, as evidenced by autopsy4 and imaging studies.5 The characteristic radiological presentation on MRI is hyperintensity in the central pons and/or various extrapontine structures such as the basal ganglia and thalamus on T2 weighted (T2W) and fluid attenuated inversion recovery (FLAIR) sequence and hypointensity on T1 weighted (T1W) MRI.2 6
Although earlier reports on ODS have shown very poor outcome,1 3 recent reports suggest the contrary, mainly due to early diagnosis and improved intensive care treatment.6 7 Most of the available literature on ODS is either case reports or small series, focussing on MRI abnormalities or the variable clinical manifestations and the clinical outcome with short follow-up.6 8–13 No objective scales assessing the final disability have ever been used to quantify the long-term functional outcome of a large group of ODS patients. This is especially important because of the prevailing notion that a majority of these patients ultimately die or become dependent for activities of daily living (ADL), and only very few would recover and become fully functional. We undertook this study with the following objectives:
To study the clinical and functional outcome subjectively and objectively in a cohort of patients with ODS prospectively followed up in our Institute.
To identify any potential clinicoradiological features that can predict the final outcome in ODS.
Methods
Twenty-five consecutive cases of ODS from June 1999 to October 2008 formed the study cohort. Cases were identified from a prospectively maintained hospital database. The diagnosis of ODS was made by the clinical features at presentation and during a hospital stay, corroborated by imaging findings. The demographic details, possible aetiologies, clinical features, comorbidities and investigations were abstracted from the case records. All patients with hyponatraemia received intravenous 3% sodium chloride with the aim of slow correction when the initial serum sodium level was ≤120 mEq/l, especially when associated with neurological symptoms. Patients with euvolaemic hyponatraemia received extra oral salt with fluid restriction, and intravenous normal saline was given for hypovolaemic hyponatraemia. All underwent MRI performed on a 1.5 T scanner (Signa GE, Milwaukee, WI) except in two where CT alone was done in view of MRI-incompatible implants. A neuroradiologist (CKD) reviewed all patients' MRIs. A lesion restricted to the pons on imaging was classified as CPM, lesions involving sites other than the pons were classified as EPM, and those who had involvement of both pons and extrapontine structures were classified as having a combination of CPM and EPM.3
All living patients except one were interviewed and examined by the same investigator (RKN) at last follow-up. Two functional scales—the Disability Rating Scale (DRS)14 and Functional Independence Measure (FIM)15—were applied for each patient at three points, at the time of admission and discharge from the hospital and at last follow-up. DRS is a 30-point measure consisting of eight items corresponding to the following areas of functioning: eye opening, verbalisation, motor response, level of cognitive ability for feeding, toileting and grooming, overall level of independence and employability. Ratings were summarised to yield a total score ranging from 0 to 29, with 29 representing the lowest level of functioning, consistent with a vegetative state and score 0 indicating no disability. FIM measures activities of daily living involving six domains: self care, sphincter control, transfers, locomotion, communication and social cognition. The highest score of 126 indicates the best level of functioning, and the lowest score of 18 indicates a very poor level of functioning.
The outcome at last follow-up was divided into ‘favourable’ and ‘poor outcome.’ A ‘favourable outcome’ patient was defined as one who became independent for ADL, and ‘poor outcome’ as one who remained dependent on care givers for ADL or died, secondary to ODS. The variables were divided for prognostication as follows: age ≥55 versus ≤54 years, hyponatraemia ≤115 versus ≥116 mEq/l and Glasgow Coma Scale (GCS) at admission and at discharge, ≤10 versus ≥11.
Statistical analysis
The demographic data and variables were expressed as percentages, mean±SD, median and range. The Fisher exact test and Mann–Whitney U tests were used for univariate analysis of categorical and continuous variables respectively. All the variables that were found statistically significant in the univariate analysis were subjected to multivariate analysis using the stepwise multiple logistic regression model with the forward likelihood ratio method. A p value ≤0.05 was taken as significant.
Results
The median age of the patients at presentation was 55 years (range 6–69 years). Thirteen were females, 20 (80%) had encephalopathy at presentation, and 10 (40%) had clinical recovery from initial encephalopathy before developing the ODS. The mean interval between the recovery and the development of ODS was 2.2 ±1.1 days. Eleven (44%) had extrapyramidal syndrome at presentation and 4 more (16%) developed various extrapyramidal manifestations at discharge, of which 14 (56%) had akinetic-rigid syndrome, and one had generalised dystonia and opsoclonus. Seizures occurred in nine patients (36%). Twelve patients were bed-bound, and nine patients had various eye movement abnormalities at the time of discharge in the form of slow saccades (n=2), nystagmus (n=1), ocular bobbing (n=1) and vertical gaze palsy (n=5). The demographic data and clinical features are summarised in table 1.
Clinical manifestations, investigations and subtypes of osmotic demyelination syndrome (n=25)
The predisposing comorbidities that lead on to ODS are summarised in table 2. A total of 20 patients developed ODS in hospital after they were admitted for the evaluation of delirium. Another three patients developed ODS in hospital after undergoing elective neurosurgery (n=2) or cardiovascular surgery (n=1). The remaining two patients developed ODS before admission to our hospital. Three patients (12%) had malnutrition, and one patient was a chronic alcoholic. The mean and median serum sodium was 108±10 mEq/l and 105.5 mEq/l (range 91–130) respectively in the 20 (80%) patients with hyponatraemia. The mean and median potassium levels were 2.8±0.26 mEq/l and 2.8 mEq/l (range 2.5–3.3) respectively in 10 (40%) patients with associated hypokalaemia. Twelve (60%) patients had documented rapid correction of hyponatraemia by more than 8 mEq/l per day.
Various predisposing factors and associated comorbidities at the time of presentation of osmotic demyelination syndrome (n=25)
The EEG in eight (66.7%) patients (n=12) revealed generalised slowing (n=5), triphasic waves (n=2) or bilateral periodic lateralised epileptiform discharges (n=1). Four had no EEG abnormalities. Nerve-conduction studies (NCS) coupled with clinical features suggested neuropathy in four (demyelinating in two and predominantly axonal in two).The axonal neuropathies were probably secondary to critical illness neuropathy (n=1) or secondary to chemotherapy (n=1).
CT was done in seven cases and was positive in two (28.5%). All had MRI-detectable lesions (n=23). Six required repeat MRI as the initial one did not reveal any lesion. The mean interval between the first and repeat imaging was 10.6 days in these patients (range 9–17 days). There were T1W hypointense and T2W and FLAIR sequence hyperintense lesions involving pons (76%), basal ganglia (76%) and thalamus (20%) (figures 1 and 2). Contrast enhancement was not seen in any of the cases. Diffusion-weighted imaging (n=3) showed a restricted diffusion in two cases. The radiological findings are summarised in table 3.

Sequential MRI of a 48-year-old woman with osmotic demyelination syndrome (ODS) who developed Wernicke's encephalopathy secondary to chronic diarrhoea following surgery and radiotherapy for carcinoma rectum in August 2008. (A, B) Axial T2 weighted images showing hyperintensities involving periaqueductal area (arrow) and bilateral medial thalami (arrow). After making a near-total recovery from Wernicke's encephalopathy, she developed hyponatraemia after 3 weeks that was rapidly corrected, and she developed a recurrence of encephalopathy with a GCS of 8. MRI was done after 34 days of admission when her GCS was 8. (C, D, E) Axial T2 weighted image, diffusion-weighted image (DWI) and apparent diffusion coefficient (ADC) map showing the typical T2 hyper intensity (arrow) of the mid-pons with surrounding rim of normal pontine parenchyma and sparing of the corticospinal tract. The lesion is hyperintense in DWI and shows diffusion restriction in the ADC map (arrow). (F, G, H) Axial FLAIR, DWI and ADC map showing a hyperintense lesion in the right hippocampus with mild diffusion restriction (arrow).

Sequential MRI of a 48-year-old woman with osmotic demyelination syndrome (ODS) who developed Wernicke's encephalopathy secondary to chronic diarrhoea following surgery and radiotherapy for carcinoma rectum in August 2008. Follow-up MRI was done after 54 days when the GCS was still 8. (A, B, C) Axial T2 weighted image, DWI and ADC map showing prominent mid-pons hyperintensity. There is no diffusion restriction (arrow). (D) DWI showing disappearance of the diffusion restriction in the hippocampus. (E, F) Fractional anisotropy and diffusion tensor imaging maps (black & white and colour images) showing relative preservation of the corticospinal tract (white arrow). The surrounding transverse pontine and middle cerebellar peduncle fibres show a marked reduction in anisotropy. She made an almost complete recovery in her neurological status at last follow-up (8 months after the insult) and became independent for activities of daily living. MRI was done at last follow-up. (G, H, I) Axial T2 weighted image, DWI and ADC map showing marked reduction in the size and signal intensity of the pons hyperintensity (arrow).
Radiological characteristics in osmotic demyelination syndrome (n=25)
CPM, EPM or both were seen in 20%, 28% and 52% respectively. Six patients were treated with intravenous methyl prednisolone (1 g/day) for 5 days. The remaining patients were treated symptomatically. The mean hospital stay was 28 days±31 days.
Factors predicting outcome
The mean follow-up (n=24) was 2.2±2.5 years and median follow-up was 1 year (range 0–8 years). A ‘favourable’ and ‘poor outcome’ at last follow-up was seen in 11 and 13 patients respectively. Out of the 11 patients with favourable outcome, seven became completely normal, and the remaining four were independent for ADL, but had varying mild cognitive or extrapyramidal deficits (figures 3, 4). Twelve patients died, two in hospital and 10 after a mean period of 399.8 days (range 9–1654 days) following discharge from the hospital. One patient remained in a persistent vegetative state. The cause of death was related to ODS in all.

Improvement in functional status by box plot at the time of admission (DRS 1), at the time of discharge (DRS 2) and at last follow-up (DRS3) using two functional scales: Disability Rating Scale (DRS) and Functional Independence Measure (FIM). Solid horizontal lines are median values, and length boxes are interquartile ranges (25th to 75th percentiles). The tip of the vertical lines from the top and bottom of the boxes indicates the maximum and minimum values excluding the extreme values (*).

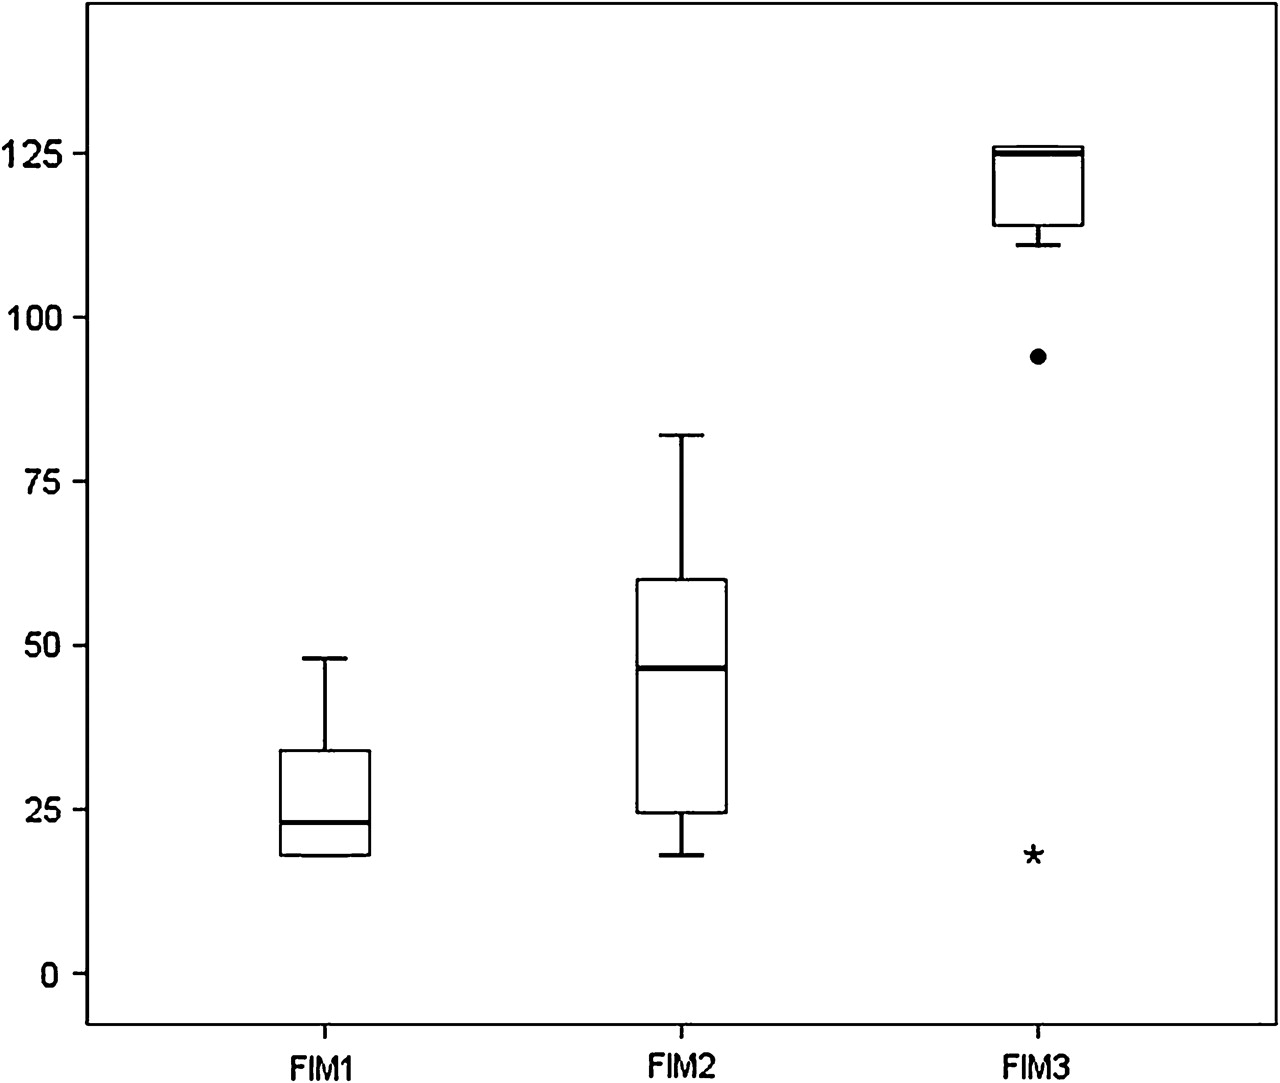
Improvement in functional status by box plot at the time of admission (FIM1), at the time of discharge (FIM2) and at last follow-up (FIM3) using two functional scales: Disability Rating Scale (DRS) and Functional Independence Measure (FIM). Solid horizontal lines are median values, and length boxes are interquartile ranges (25th to 75th percentiles). The tip of the vertical lines from the top and bottom of the boxes indicates the maximum and minimum values excluding the outliers (circle) and extreme values (*).
In univariate analysis, three factors were significantly correlated with outcome. Hyponatraemia ≤115 mEq/l (p=0.04), associated hypokalaemia (p=0.04) and GCS ≤10 at entry (p=0.008) were the factors predictive of poor outcome. A poor mean GCS ≤10 during hospital stay (p=0.049) and at discharge (p=0.033) were predictive of poor outcome. Clinical features, primary (admitting illness), type of ODS, EEG and MRI characteristics were not predictive of outcome (table 4).
Factors predicting prognosis in favourable and poor outcome groups in osmotic demyelination syndrome (n=24)
The mean FIM at admission (p=0.05) and discharge (p=0.01), and DRS at admission (p=0.05) were predictive of outcome at the last follow-up. Higher FIM scores and lower DRS scores indicating better functional ability during the hospital stay correlated with a statistically significant favourable outcome at last follow-up.
In the multivariate analysis, only hyponatraemia was statistically significant and remained in the model with an OR of 20.0 (95% CI 1.4 to 287.6) with a p value of 0.028. The wide CI and single significant variable is probably due to the small sample size.
Discussion
The osmotic demyelination syndrome is an uncommon disorder. The exact incidence is unknown. The incidence of ODS in a postmortem series of alcoholics and liver transplant recipients were as high as 30%.16 We found ODS in 8.56% of a total of 292 metabolic encephalopathy syndromes and 0.56% of a total of 15 854 neurology admissions over the same study period. The majority of the patients had chronic alcoholism as a predisposing factor in other studies.1 2 7 8 However, we found alcoholism in only one patient, and the majority had metabolic encephalopathy due to electrolyte imbalance as a predisposing factor in our series. Hypokalaemia and rapid correction of hyponatraemia are well-known risk factors.17 18 We found it in 40% and 80% respectively. The various clinical features described are in agreement with the available literature.2 3 6–8 A variety of extrapyramidal features such as parkinsonism, dystonia, chorea, athetosis and mutism have been described with ODS.2 12 13 We came across only a single patient with opsoclonus and generalised dystonia. The rest had an akinetic-rigid state. The nerve-conduction study showed a demyelinating type of neuropathy in two of our patients, which was presumed to be secondary to peripheral ODS after excluding other causes. Similar rare cases have been reported previously.7 19
In a study by Gocht et al, the distribution of subtypes of ODS as CPM, combination of CPM and EPM, and EPM was 50%, 30% and 20% respectively.20 The proportion with CPM was as high as 80% in some other studies.7 8 However, we found a combination of EPM and CPM as the most common, present in more than 50%, followed by EPM (28%) and CPM (20%). The higher incidence of extrapontine lesions in recent series and ours may be due to the availability of better-quality MRI picking up subtle lesions. Also, the extent of involvement in the imaging depends on the interval at which imaging is done after the onset of ODS.2 21 The MRI done early (1–6 days) in six (24%) of our patients failed to show any abnormality. However, in all these patients, a repeat MRI done 1–2 weeks later showed positive findings. Therefore, we concur with the other authors that a repeat MRI after 1–2 weeks in all clinically suspected cases of ODS is very helpful.2 Also, diffusion MRI can pick up early lesions when conventional MRI is still negative.22 We found basal ganglia involvement in around two-thirds of cases and cerebellar involvement in less than 10%, whereas in another series, cerebellum and the external capsule were the most commonly involved extrapontine regions 20
We treated six of our patients with intravenous methyl prednisolone. The type of treatment received did not have any bearing on the outcome. However, as treatment was administered in only a quarter of our patients, and the treatment decision was at the discretion of the treating physician, no conclusions can be drawn regarding the role of steroids from the current study. Small case series or case reports have shown a beneficial effect of various treatment modalities such as IMP,23 intravenous immunoglobulin24 and plasmapheresis.25 There are no existing guidelines or evidence to suggest the use of immunomodulatory treatment in ODS.
No study has so far identified any potential prognostic factors in ODS. Univariate analysis indicates that less severe hyponatraemia, absence of superadded hypokalaemia and higher GCS at the time of admission and at discharge are the good prognostic factors. This may indicate that the more severe the predisposing insults and clinical status at presentation, the poorer the outcome. Only hyponatraemia was found significant in predicting the outcome in multivariate analysis. The odds for a favourable outcome were 20 times higher in those with serum sodium ≥116 mEq/l than those with serum sodium ≤115 mEq/l. The type of ODS and extent of MRI abnormalities failed to have any bearing on the outcome, similar to the other studies.7 26
In a study of 44 patients where the clinical and functional outcome was assessed, a third made a complete recovery, a third were independent but with minor neurological deficits, and the remaining third became dependent for ADL on care givers.7 Unlike this study,7 we used two objective functional scales to determine the outcome. A statistically significant correlation between the functional scales at admission and at discharge and the outcome was noted. The FIM showed higher values and DRS showed lower values at admission and discharge in patients with a favourable long-term outcome and vice versa. We used these functional scales, since they are validated, well established and simple scales to assess the functional status in chronic neurological illnesses.27 We applied the two functional scales at three time points, since these simple scales could be applied meaningfully by a retrospective record review from the prospectively maintained records in our institute. However, we do agree that any functional scale should be ideally administered prospectively to yield more meaningful conclusions. Administration of these at various time points at admission and at discharge will thus help in predicting the overall long-term outcome of the patient, thus helping the treating physician to prognosticate and counsel the care givers.
In conclusion, almost half the patients with ODS do make a meaningful clinical and functional recovery. A lower GCS score at entry and poorer scores in functional scales during the hospital stay, presence of severe hyponatraemia and superadded hypokalaemia are factors predicting a poor outcome.
References
Footnotes
Competing interests None.
Ethics approval Ethics approval was provided by the Sree Chitra Tirunal Institute for Medical Sciences & Technology.
Provenance and peer review Not commissioned; externally peer reviewed.