


Abstract
Obesity is an independent risk factor for the development and progression of chronic kidney disease (CKD). We conducted a systematic review to assess the benefits of intentional weight loss in obese subjects with altered glomerular filtration rate (GFR), proteinuria or albuminuria. MEDLINE, EMBASE and CENTRAL databases were searched for articles reporting longitudinal data on the effect of weight loss on renal parameters in obese patients with altered kidney function. Thirty-one (2013 subjects) were included. In the 13 studies where weight loss was achieved by bariatric surgery, body mass index (BMI) significantly decreased in all studies; GFR decreased in six studies on hyperfiltration patients and increased in one study on patients with CKD Stage 3–4. Albuminuria decreased in six studies and proteinuria decreased in five studies. In six studies, weight loss was achieved by antiobesity agents: BMI decreased in all studies; GFR decreased in four studies and albuminuria in three. Eleven studies analysed the effects of diet, alone or in combination with lifestyle modifications. A significant decrease in BMI was reported in all studies; GFR increased in two studies, remained stable in four studies and decreased in two studies on hyperfiltration patients. Albuminuria decreased in six studies and remained stable in one study. Proteinuria decreased in five studies. In obese patients with altered renal function, weight loss, particularly if achieved by surgical interventions, improves proteinuria, albuminuria and normalizes GFR. Larger, long-term studies are needed to analyse the durability of this improvement and the effects on renal outcomes, such as CKD progression and the development of ESKD.
INTRODUCTION
Over 1.5 billion people worldwide are overweight [1] and, by 2030, 51% of the world population will be obese [2, 3]. Obesity is a notorious risk factor for mortality, morbidity and disability and has been linked to a growing number of metabolic and cardiovascular comorbidities, such as diabetes mellitus and hypertension. The deleterious effects of obesity on human health are systemic in nature, and kidney dysfunction is now recognized as a relevant health risk posed by obesity. Diabetes and hypertension are established pathways whereby fat excess may induce renal damage but the risk for chronic kidney disease (CKD) in obesity is largely independent of these comorbidities [4]. Population-based studies both in the USA [5] and in Europe [6] coherently documented an independent association between a higher body mass index (BMI) and incident CKD risk, and excessive adiposity is well recognized as an amplifier for the risk of renal disease progression in patients with CKD of various aetiology [7]. Renal alterations induced by obesity include hyperfiltration, pathological proteinuria/albuminuria and reduced glomerular filtration rate (GFR) but mechanisms underlying these alterations are still incompletely understood [8]. The effects of weight loss approaches on selected outcomes, such as proteinuria or hypertension, have extensively been reviewed elsewhere [9, 10], and the National Kidney Foundation has recommended weight reduction for diabetic patients with CKD Stage 1–4 [11]. However, whether or not intentional weight loss for patients with established renal damage might produce benefits for renal function, independently of diabetes and hypertension control, remains unknown. In this systematic review, we aimed at evaluating whether weight loss achieved by various interventions, including diet, exercise, lifestyle changes, pharmacological treatment and bariatric surgery, may improve parameters of renal function/damage in obese patients with impaired renal function of various degree.
MATERIALS AND METHODS
Data source and search strategy
MEDLINE, EMBASE and CENTRAL databases were searched for English-language articles without time restriction up to 28 December 2012 through focused, high sensitive search strategies (Supplementary Table 1). References from relevant studies and reviews published on the same topic were screened for supplementary articles. The search was designed and performed by one Author (D.B.) and independently re-assessed by another (C.Z.).
Study selection
We included any randomized or nonrandomized trial, single-arm, prospective or retrospective observational study providing longitudinal data on the effect of weight loss on renal parameters in obese patients with established impairment in kidney function. Studies were considered without follow-up duration restrictions. Obesity was defined as the presence of a BMI >30 kg/m2. Renal function impairment was considered as the stable presence of one of more of the following conditions: (i) GFR <90 or >125 mL/min (hyperfiltration), (ii) serum creatinine>1.3 mg/dL, (iii) ESKD requiring chronic replacement therapy and (iv) pathological proteinuria or albuminuria. Studies where at least part of the population fulfilled the above criteria were included in the review. We considered any kind of intervention targeting weight loss, including bariatric surgery, diet (excluding low protein diets), any lifestyle modification, exercise, antiobesity drugs or multidisciplinary programmes including two or more of these interventions. Renal parameters of interest were GFR (either measured or estimated by any validated formula), serum creatinine, proteinuria or albuminuria (either quantified as 24-h urine excretion or as single sample ratio to creatinine). Studies were excluded if: (i) dealing only with the effects of obesity on renal function, without mentioning any intervention on weight loss, (ii) including no patients with BMI>30 kg/m2 and/or evidence of alterations in renal function, (iii) not providing longitudinal data on renal parameters after weight loss and (iv) examining weight loss related to fluid control in dialysis patients. Case reports, reviews, editorials, letters and studies performed on children (age < 18) or animals were excluded as well. Data extraction was performed by one Author (D.B.) and independently checked by another (C.Z.).
Quality assessment
We used the Newcastle-Ottawa Scale [12] to assess the study quality for observational studies. This scale considers a quality score calculated on the basis of three major issues: study participants (0–4 points), adjustment for confounding (0–2 points) or ascertainment of the exposure or outcome of interest (0–3 points) with a maximum score of 9 points, which represents the highest methodological quality. The quality of randomized controlled trials (RCTs) was assessed using the checklist developed by the Cochrane Renal Group, which evaluates the presence of potential selection bias (random sequence generation and allocation concealment), performance bias (blinding of investigators and participants), detection bias (blinding of outcome assessors), attrition bias (incomplete outcome data) and reporting bias (selective reporting).
Data extraction and analysis
Data extraction and analysis were performed by one reviewer (D.B.) and independently verified by another reviewer (C.Z.). In studies considering mixed populations, the subgroup of patients with documented impaired renal function was considered for analysis only if corresponding data were available. Data reported as median and range were converted to mean and SD by using the formula by Hozo [13].
RESULTS
Search results
The flow diagram of the selection process is depicted in Figure 1. One thousand five hundred potentially relevant references were initially found. A total of 1460 citations were excluded either because of search overlap, dealing with the wrong population (CKD not present/not defined or BMI <30 kg/m2) or because they were review articles or case reports. Among 40 studies selected for full text examination, nine were excluded because: duplicate reports (n = 2); did not provide data on the evolution of renal function after weight loss (n = 3); renal impairment was not documented (n = 3); data were reported in Japanese language (n = 1). A total of 31 studies were therefore reviewed in detail and included in the review. Main characteristics of these studies are summarized in Tables 1 and 2.
Nonrandomized studies on the effects of weight loss on chronic kidney disease
| Authors | Year | Study type | Population | Intervention | End point(s) | Results | Notes |
|---|---|---|---|---|---|---|---|
| Studies on bariatric surgery | |||||||
| Brøchner-Mortensen et al. [14] | 1980 | Prospective | 25 obese patients (Body weight 136.4 kg) with hyperfiltration | Intestinal bypass operation | mGFR Creatinine | Reduction in body weight, mGFR and plasma creatinine (P < 0.02 for both) 1 year after surgery. | GFR measured by 51Cr EDTA. No variations in mGFR values when corrected to body surface or ECV. |
| Chagnac et al. [15] | 2003 | Prospective | 8 severely obese subjects (48.0 ± 2.4 kg/m2) with hyperfiltration and microalbuminuria | Gastroplasty | mGFR Albuminuria | After surgery BMI, (P < 0.001), mGFR and albumin excretion (P < 0.01) decreased from baseline. | GFR measured by insulin clearance. Weight loss decreased also renal plasma flow, fractional clearance of albumin, systolic BP, plasma glucose and plasma insulin. |
| Palomar et al. [16] | 2005 | Prospective | 35 morbidly obese patients (BMI 46.9 ± 6.3 kg/m2) with proteinuria; 18% with DM; 25% with impaired glucose tolerance. | Bilio-pancreatic diversion | Albuminuria Proteinuria | Significant reduction 1 year after surgery in BMI (P < 0.05), albuminuria (P < 0.01) and proteinuria (P < 0.01) | Surgery reduced urinary calcium and citrate excretion and increased oxaluria, without increasing the incidence of calcium stones. |
| Navarro-Diaz et al. [17] | 2006 | Prospective | 61 morbidly obese patients (BMI 53.62 ± 9.65 kg/m2) with hyperfiltration and pathological albuminuria and proteinuria | Gastric bypass with gastroplasty | eGFR Creatinine Albuminuria Proteinuria | BMI (P < 0.001), creatinine (P < 0.001), eGFR (P < 0.001), proteinuria (P = 0.004) and albuminuria (P < 0.001) all improved 1 year after surgery. Albuminuria (P = 0.006) and BMI (P = 0.01) kept improving also after 2 years | Significant reduction in the percentage of patients with hyperfiltration. |
| Serra et al. [18] | 2006 | Prospective | 70 severely obese patients (BMI 53.27 ± 79.58kg/m2), some with pathological albuminuria/proteinuria | Roux-en-Y gastric bypass | eGFR Proteinuria Albuminuria | BMI (P < 0.001), eGFR (P < 0.001), proteinuria (P < 0.001) and albuminuria (P < 0.01) all improved 1 year after surgery. | Significant changes were reported in adiponectin, leptin, C-reactive protein levels and insulin sensitivity. |
| Agrawal et al. [19] | 2008 | Retrospective | 94 obese subjects (BMI 49.1 ± 8.0 kg/m2), 21 with microalbuminuria, 32 with DM, 37 with metabolic syndrome | Roux-en-Y gastric bypass | Albuminuria (ACR) Creatinine | Significant decrease in ACR in diabetics (P = 0.001) and metabolic syndrome (P = 0.012). Changes in ACR were greatest in diabetics (–64%), intermediate in metabolic syndrome (–35%) and lowest in patients with obesity alone (–24%) (P for difference between groups = 0.044). No changes reported in creatinine values. | Patients with macroalbuminuria excluded. Diabetics had a reduced prevalence of microalbuminuria (35.7–7.1%, P = 0.008) after surgery. |
| Serpa Neto et al. [20] | 2009 | Retrospective | 140 morbidly obese patients (BMI 46.1 ± 5.4 kg/m2), some with albuminuria, hyperfiltration or hyperglycaemia | Roux-en-Y gastric bypass | eGFR Proteinuria Albuminuria | Surgery significantly reduced BMI (P < 0.0001), eGFR (P < 0.0001), proteinuria (P = 0.05) and albuminuria (P = 0.05) after 8 months. | Weight loss reduced also the percentage of patients with hyperfiltration and pathological proteinuria or albuminuria and values of BP, glycaemia, uric acid and urinary creatinine. Variations in systolic and diastolic blood pressure were predictors of GFR change. |
| Wesley Alexander et al. [21] | 2009 | Prospective | 9 CKD (2 in HD) of different degree (BMI 48.9 ± 1.9 kg/m2) | Gastric bypass | Creatinine (1/sCr) | One patient had biopsy-proven resolution of MGN. Two patients discontinued dialysis for 27 and 7 months, respectively. The remaining patients had stable renal function for 2–5 years postoperatively. | Patients analysed were an inception cohort of patients with renal function improvement originating from a population of 45 obese patients. |
| Navaneethan et al. [22] | 2009 | Retrospective | 25 CKD Stage 3 patients (mean eGFR 47.9 mL/min/1.73 m2; mean BMI 49.8 kg/m2) | Bariatric surgery (not defined) | eGFR | Mean eGFR increased to 56.6 mL/min/1.73 m2 at 6 months (P < 0.001) and to 61.6 mL/min/1.73 m2 at 1 year (P < 0.001); BMI decreased to 38.4 kg/m2 (P < 0.001) after 6 months and 34.5 kg/m2 after 1 year. | Surgery produced significant improvement also in BP control. |
| Navaneethan et al. [23] | 2010 | Prospective | 15 severely obese DM-type 2 patients (mean BMI 49 ± 9.0 kg/m2). 7 patients with preexisting microalbuminuria | Roux-en-Y gastric bypass (n = 9) or other types of bariatric surgery (n = 6) | Albuminuria (ACR) Creatinine | 6 months after surgery, significant decrease in BMI (P < 0.05) and serum creatinine (P < 0.001) in all patients. Significant decrease in ACR (P = 0.01) only following RY. Significant decrease in ACR (P = 0.04) in patients with preexisting microalbuminuria. No changes in those with Normoalbuminuria (n = 8). | Significant decrease in fasting blood glucose and total cholesterol in all patients. Significant improvement in adiponectin and insulin sensitivity only after RY. |
| Schuster et al. [24] | 2011 | Retrospective | 56 obese subjects with mild (n = 40;creatinine 1.3–1.6 mg/dL; mean BMI 50.7 ± 10.8 kg/m2) or moderate (n = 16; creatinine>1.6 mg/dL; mean BMI 53.1 ± 8.4 kg/m2) renal impairment | Roux-en-Y gastric bypass | Creatinine | 76.7% of patients with achieved normal creatinine levels, 12.5% developed mild impairment (sCr 1.3–1.6 mg/dL) and 10.7% moderate impairment (sCr > 1.6 mg/dL). | Inception cohort with CKD of a wider cohort of 813 obese patients. No statistical significances provided. |
| Mohan et al. [25] | 2012 | Retrospective | 15 morbidly obese subjects (mean BMI 44.3 ± 6.5 kg/m2) | Roux-en-Y gastric bypass | Albuminuria (ACR) | Significant decrease in albuminuria (P = 0.029) and BMI (P < 0.001) after surgery. | No significant decrease in systolic or diastolic blood pressure. No correlations between albumin and weight loss |
| Mac Laughlin et al. [26] | 2012 | Retrospective | 9 obese patients with CKD (not quantified), 5 of them in HD treatment) | Laparoscopic sleeve Gastrectomy (LSG) | eGFR Proteinuria | Reduction in BMI (median: 8.4 kg/m2), eGFR and proteinuria 6 months after LSG. | eGFR and proteinuria decrease not quantified. Statistical significance not provided. |
| Studies on diet and/or lifestyle interventions | |||||||
| Vasquez et al. [27] | 1984 | Prospective | 24 obese DM-II subjects (BMI 38.4 ± 2.1 kg/m2), 6 morbidly obese glucose-intolerant subjects (BMI 47.6 ± 4.8 kg/m2) some with pathological albuminuria and 7 nondiabetic obese subjects (BMI 36.1 ± 3.2 kg/m2) with normal albuminuria. | 4 weeks of 500 kCal-restriction diet | Proteinuria Albuminuria | Diet produced a statistically significant reduction in proteinuria (P < 0.001) and albuminuria (P = 0.01) in obese diabetic subjects and a nonsignificant reduction in other groups. | The decrease in albuminuria in all subjects was significantly correlated to baseline albumin excretion (r = 0.63, P < 0.0001). |
| Solerte et al. [28] | 1989 | Prospective | 24 obese DM-type I and II patients (BMI 33 ± 1.6 kg/m2) with CKD (eGFR 66 ± 13 mL/min) | 1 year of hypocaloric diet (1410 kCal/day) | eGFR Albuminuria Proteinuria | Weight loss reduced BMI (P < 0.001), proteinuria (P = 0.01) and albuminuria (P = 0.01) and improved eGFR (P = 0.01). | Diet improved also BP, triglycerides, total, LDL and HDL cholesterol. |
| Saiki et al. [29] | 2005 | Prospective | 22 obese DM-type II patients (BMI 30.4 ± 5.3 kg/m2) with diabetic nephropathy (eGFR 40.6 ± 17.9 mL/min; Proteinuria 3.27 ± 2.63 g/24 h) | 4 weeks of 740–970 kCal diet | eGFR Creatinine Proteinuria | Diet significantly reduced BMI (P < 0.0001), creatinine (P < 0.0001) and proteinuria (P < 0.0001) with no significant changes on eGFR. | Changes in creatinine and proteinuria were significantly related to those on BMI (r = 0.62 and 0.49 respectively). Diet improved also BP, glycated haemoglobin and lipid profile. |
| Gilardini et al. [30] | 2010 | Prospective | 269 obese nondiabetic women (BMI 36.8 ± 4.6 kg/m2), 17 with pathological albuminuria | 3 months of lifestyle intervention including periodic visits for education, advice reinforcement in dietary and exercise management. | eGFR Creatinine Albuminuria | BMI decreased in all subjects (P < 0.05). Creatinine and eGFR remained stable. 8 of 17 women with microalbuminuria became normoalbuminuric. | Waist circumference decreased in all subjects. Insulin sensitivity and glucose levels significantly decreased only are women with improvement in albuminuria. |
| Shen et al. [31] | 2010 | Prospective | 63 obese patients (BMI 30.83 ± 2.86 kg/m2) with biopsy-proven obesity-related glomerulopathy (55.6% FSGS) and proteinuria (1.48 ± 0.87 g/24 h) | 24 months of 500 kCal-restriction diet + aerobic exercise 3 days/week | eGFR Proteinuria | At 6 months, 27 patients lost weight by 8.29 ± 4.00%, with a mean decrease in proteinuria of 35.3%, At 24 months later, 27 patients achieved a 9.20 ± 3.78% reduction in BMI and a 51.33% reduction in proteinuria (both P < 0.0001). In patients with increased BMI, proteinuria increased by 28.78%. | Weight loss improved also lipid profile, BP Changes in BMI were the only predictor of proteinuria (P < 0.01). |
| Ezequiel et al. [32] | 2012 | Prospective | 35 nondiabetic obese patients with metabolic syndrome, pathological albuminuria but conserved eGFR | 12 weeks of low calories diet | eGFR Albuminuria | In responders (n = 14), diet produced a significant reduction in albuminuria and eGFR (both P < 0.001). | Diet improved also lipid profile in responders. |
| Studies on pharmacologic interventions alone or combined with other interventions | |||||||
| Tong et al. [33] | 2002 | Prospective | 33 Chinese obese patients with DM-type II (34.2 ± 4.7 kg/m2) and 27 obese nondiabetic patients (37.2 ± 6.0 kg/m2), with pathological albuminuria | 6 months of Orlistat 120 mg/3 times day | Albuminuria | Orlistat produced a significant reduction in BMI in both groups (P < 0.001). Albuminuria was significantly reduced (P < 0.05) only in nondiabetic patients. | Nondiabetic patients had baseline albuminuria levels significantly lower and BMI significantly higher than diabetic patients (P < 0.001). |
| Cook et al. [34] | 2008 | Prospective | 32 obese CKD patients (BMI 35.7 ± 4.5 kg/m2; eGFR 44.8 ± 26 mL/min/1.73 m2) | 1 year of structured weight loss programme including: Orlistat 120 mg/3 times day, low calories diet and individualized exercise programme | eGFR | Weight loss programme significantly reduced BMI (P < 0.001) but also eGFR (P < 0.05) | The programme improved physical and functional ability and waist circumference. |
| Cubeddu et al. [35] | 2008 | Prospective | 38 nondiabetic obese/overweight patients (30.9 ± 0.8 kg/m2) all with normoalbuminuria and 16 with hyperfiltration | 1 year of structured weight loss programme including: Metformin 500 mg 1–3 times/day, low calories diet (1600–2000 kCal) and aerobic activity. | eGFR Albuminuria | Weight loss programme significantly reduced BMI (P < 0.001), albuminuria (P < 0.001) and eGFR (P = 0.01) in the whole population. | Intervention-induced changes in albuminuria were not significantly related to BP, age or body weight. |
| MacLaughlin et al. [36] | 2010 | Nonrandomized, controlled trial | 64 obese patients with CKD Stage 3–4 (n = 21) and CKD-5D (n = 43) (BMI range 27.9–54.0 kg/m2) | Intervention group (n = 44): 6 months of structured weight loss programme (plus a further 18 months of follow-up) including: Orlistat 120 mg/3 times day, low calories diet and aerobic exercise Comparator group (n = 20): usual care. | eGFR | After 24 months, body weight decreased more in the intervention versus the comparator group (P < 0.001), eGFR decreased less in the intervention than in the comparator group (P < 0.001). | 12 subjects dropped out from the intervention group. Adverse effects reported were diarrhoea, flatulence and fatty stools. |
| MacLaughlin et al. [37] | 2012 | Prospective | 135 obese patients (BMI 36.4 ± 5.6 kg/m2) with CKD (eGFR 36.3 ± 22.1 mL/min/1.73 m2), of whom 30 (17%) were in HD. | 2 years of a structured weight loss programme including: Orlistat 120 mg/3 times day, low calories diet and aerobic exercise. | eGFR | Weight loss programme significantly reduced BMI (P < 0.001) but also eGFR (P < 0.001). | Systolic BP and lipid profile were significantly improved. |
ACR: albumin-creatinine ratio; BMI: body mass index; BP: blood pressure; CKD: chronic kidney disease; DM: diabetes mellitus; ECV: extra-cellular volume; eGFR: estimated glomerular filtration rate; FSGS: focal segmental glomerulosclerosis; HD: haemodialysis; kCal: kilo-calories; GBP: gastric bypass; mGFR: measured glomerular filtration rate; MGN: membranous glomerulonephritis; RY: Roux-en-Y gastric bypass; sCr: serum creatinine.
Randomized controlled trials of the effects of weight loss on chronic kidney disease
| Authors | Year | Population | Intervention | Comparator | Duration | End point | Outcome | Notes |
|---|---|---|---|---|---|---|---|---|
| Stenlof et al. [38] | 2006 | 541 obese NIDDM patients with microalbuminuria (mean BMI 36 kg/m2) | Topiramate 96 mg/day (n = 180) Topiramate 192 mg/day (n = 180) | Placebo (n = 181) | 8-week titration + 40-week treatment | Albuminuria | −16.19 mean change with Topiramate 96 mg/day, −15.72 reduction with Topiramate 192 mg/day versus −1.01 mean change with Placebo (P < 0.01) | Significant reductions in BP and HbA1c reported after Topiramate treatment. Study ended early. Efficacy data reported for 229 patients on an ITT basis for 40 weeks of treatment. CNS adverse events reported. |
| BMI | 6.6% reduction with Topiramate 96 mg/day, 9.1% reduction with Topiramate 192 mg/day versus 2.5% reduction with Placebo (P < 0.001 versus other interventions) | |||||||
| Praga et al. [39] | 1995 | 17 obese patients (BMI 37.9 ± 4.1 kg/m2) with proteinuria (3.1 ± 1.7 g/24 h) and conserved GFR. | Hypocaloric diet (1000–1400 kCal/day) (n = 9) | Captopril (25–150 mg/day) without dietary restriction (n = 8) | 12 months | eGFR | Remained stable in both groups. | No changes in MAP in both groups at the end of the study. Significant correlation between weight loss and decrease in proteinuria (r = 0.69; P < 0.05). |
| Creatinine | Remained stable in both groups. | |||||||
| Proteinuria | Decrease in both diet (2.9 ± 1.7 to 0.4 ± 0.6 g/24 h; P < 0.05) and captopril (3.4 ± 1.7 to 0.7 ± 1g/24 h; P < 0.05) groups. | |||||||
| BMI | Decrease in diet group (37.1 ± 3 to 32.6 ± 3.2 kg/m2; P < 0.05). No changes in captopril group. | |||||||
| Nicholson et al. [40] | 1999 | 11 NIDDM patients with microalbuminuria | Low fat vegan diet (n = 7) | Standard diet (n = 4) | 12 weeks | Albuminuria | Non statistically significant decrease in the experimental group (438.8 ± 565.5 versus 155.2 ± 182.6 mg/24 h). Non statistically significant increase in control group (82.9 ± 114.6 versus 169.2 ± 298.0 mg/24 h) | Baseline albuminuria values apparently different between the experimental and control groups. No significant changes reported in BP and HbA1c values. 28% Fasting glucose reduction in experimental versus 12% reduction in control group (P < 0.05) |
| Body weight | 7.2 kg mean reduction in experimental versus 3.8 kg in the control group (P < 0.005) | |||||||
| Morales et al. [41] | 2003 | 30 obese (BMI> 27 kg/m2) patients with chronic (>1 year) diabetic and nondiabetic proteinuria (>1 g/24 h) and serum creatinine <2 mg/dL | 500 kcal energy reduction diet (n = 20) | Standard diet (n = 10) | 5 months | Proteinuria | Significant decrease in the diet group (2.8 ± 1.4 versus 1.9 ± 1.4 g/24 h; P < 0.005) and tendency to increase in the control group (3 ± 2.2 versus 3.5 ± 2.1 g/24 h; P = NS) (P < 0.05 difference between groups). | Decrease in proteinuria was significantly associated to weight loss (r = 0.62; P < 0.01) |
| Creatinine | No variations in the diet group. Significant increase in control group (1.6 ± 0.5 versus 1.8 ± 0.6 mg/dL; P < 0.01). | |||||||
| eGFR | No variations in the diet group. Significant decrease in control group (61.8 ± 22.1 versus 56 ± 19.9 mL/min/1.73 m2 ; P < 0.05). | |||||||
| BMI | Significant decrease in the diet (33 ± 3.5 versus 31.6 ± 3.2 kg/m2; P < 0.01) and increase in the control group (34.3 ± 5.7 versus 35 ± 5.8 kg/m2; P < 0.05)(P < 0.05 for comparison between groups). | |||||||
| Seligman et al. [42] | 2011 | 75 nondiabetic obese subjects, some with microalbuminuria | No-sugar diet + step counting exercise (n = 25) No-sugar diet + 3-times a week fitness exercise (n = 25) | 1 h walking a day exercise + low-fat diet (n = 25) | 12 weeks | Albuminuria | Decrease in fitness [8.8 (1–52) versus 4.8 (1–46) mg/dL] and low-fat diet group [4.5 (1–90.1) versus 3.7 (1–90.1) mg/dL; P < 0.05 versus fitness group]. Apparent increase in step counting group [5.7 (1–76) versus 5.9 (1–53) mg/dL]. | Improvement in BMI, BP, waist, insulin levels and resistance index, IGF-1, glucose and lipid profiles) in all groups. |
| Straznicky et al. [43] | 2011 | 38 obese (BMI <40 kg/m2) or overweight nondiabetic subjects, some with microalbuminuria or CKD-2 | Caloric restriction (n = 13) Caloric restriction + aerobic exercise (n = 13) | Standard care (n = 12) | 12 weeks | Albuminuria | No variations in control group. Significant decrease from baseline in caloric restriction- (46 ± 31 versus 16 ± 8 mg/24 h; P = 0.01) and caloric restriction + exercise- group (31 ± 4 versus 15 ± 5 mg/24 h; P = 0.01). | Baseline albuminuria apparently different between groups at baseline. Significant improvement in both intervention groups also in waist, sympathetic nervous activity, spontaneous baroreflex sensitivity, fasting glucose and insulin, insulin resistance, triglycerides and SBP. |
| Creatinine | No variations in control group. Significant decrease from baseline in caloric restriction (74.8 ± 4.1 versus 67.5 ± 3.9 µmol/L; P < 0.05) and caloric restriction + exercise- group (75.2 ± 4.0 versus 64.0 ± 4.1 µmol/L; P < 0.001). | |||||||
| eGFR | No variations in control group. Significant increase from baseline in caloric restriction- (74.5 ± 4.0 versus 83.4 ± 3.1 mL/min; P < 0.01) and caloric restriction + exercise- group (76.6 ± 4.0 versus 94.6 ± 5.5 mL/min; P < 0.001). | |||||||
| BMI | No variations in control group. Significant decrease from baseline in caloric restriction- (32.7 ± 0.9 versus 30.0 ± 0.9 kg/m2; P < 0.001) and caloric restriction + exercise group (31.9 ± 1.2 versus 28.5 ± 1.1 kg/m2; P < 0.001). | |||||||
| Leehey et al. [44] | 2009 | 13 obese (BMI >30 kg/m2) diabetic subjects, with CKD Stage 2–4 and persistent proteinuria | Thrice weekly aerobic training for 6 followed by 18 weeks of supervised home exercise (n = 7) | Standard care (n = 6) | 24 weeks | Proteinuria | A nonsignificant trend in 24-h proteinuria was observed in exercise group. | Exercise training resulted in an increase in exercise duration during treadmill testing and produced a slight but insignificant decrease in resting systolic blood pressure. Exercise did not alter, haemoglobin, glycated haemoglobin, serum lipids or C-reactive protein. |
| Albuminuria | No significant changes from baseline in both groups. | |||||||
| Creatinine | No significant changes from baseline in both groups. | |||||||
| eGFR | No significant changes from baseline in both groups. | |||||||
| Body weight | No significant changes from baseline in both groups. |
BMI, body mass index; BP, blood pressure; CKD, chronic kidney disease; CNS, central nervous system; FMD, flow-mediated dilation; eGFR, estimated glomerular filtration rate; IGF-1, insulin growth factor 1; ITT, intention to treat; MAP, mean arterial pressure; NIDDM, noninsulin-dependent diabetes mellitus; SBP, systolic blood pressure.
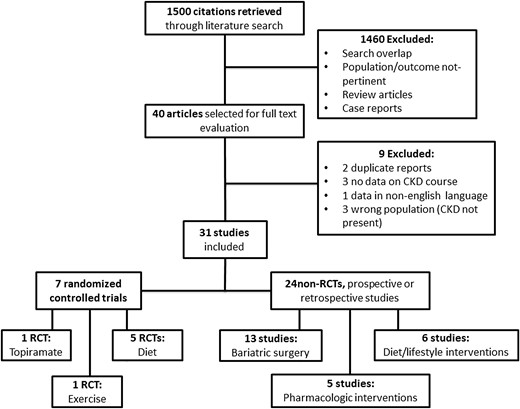
Flow diagram of the selection process.
Study characteristics
Types of studies, interventions and renal parameters
Among the 31 studies reviewed, 24 were nonrandomized studies [14–37], including 17 prospective [14–18, 21, 23, 27–37], 6 retrospective reports [19, 20, 22, 24–26] and one controlled trial [36]. Thirteen studies were focused on the effects of bariatric surgery [14–26], six on diet alone or combined with lifestyle modifications [27–32] and five on pharmacologic therapy alone or combined with other interventions [33–37]. In one study [25], renal parameters assessment was made before and immediately after surgical intervention. In the other studies, the follow-up duration ranged from 4 weeks to 5 years.
Seven studies [38–44] were RCTs. One RCT [38] compared the drug Topiramate at two different dosages versus placebo, one study compared an exercise programme versus standard care [44], while in the other five RCTs [39–43], patients were randomized to caloric restriction (alone or in combination with changes in lifestyle) versus standard diet. In one of these studies [39], patients allocated to the comparator group also received captopril.
The overall follow-up duration of RCTs ranged from 12 weeks to 12 months.
Creatinine evaluation pre–post weight loss was reported in 12 studies [14, 17, 19, 21, 23, 24, 29, 30, 39, 41, 43, 44] while data on GFR were available in 20 studies [14, 15, 17, 18, 20, 22, 26, 28–32, 34–37, 39, 41, 43, 44]. GFR was measured by 51Cr EDTA in one study [14] and by insulin clearance in another [15]. In the remaining, GFR was estimated in eight cases by 24-h creatinine clearance [17, 18, 20, 28, 29, 32, 35, 39], in six cases by the Modification of Diet in Renal Disease (MDRD) 4-variable equation [22, 26, 30, 31, 36, 37] and in one case by the Cockcroft–Gault formula [41]. In one study [43], the GFR was estimated with the Cockcroft–Gault formula, the MDRD 4-variable equation and the 24-h clearance creatinine as well. In another study [44], the GFR was estimated both with the 24-h clearance of creatinine and with the formula: creatinine clearance + urea clearance/2. Finally, in one study [34], the way used to estimate the GFR was not specified.
Albuminuria was evaluated pre–post intervention in 19 studies [15–20, 23, 25, 27, 28, 30, 32, 33, 35, 38, 40, 42–44] and proteinuria in 12 [16–18, 20, 26–29, 31, 39, 41, 44].
Study quality
The study quality of RCTs was variable. Data on random sequence generation and allocation concealment were not provided in any of the RCTs included. Attrition bias was low in all studies with the exception of Stenlof [38] where efficacy data were reported for a predefined modified intent-to-treat population (n = 229/541) with 40 weeks of treatment. Performance and detection bias were low in this RCT (which was double-blinded) and high in the other six which were all open-label [39–44]. Reporting bias was low in all studies as all the outcomes defined were reported. The general quality of observational studies was low to moderate with a median quality score of 5 points (range: 2–8).
Effect of different weight loss interventions
Bariatric surgery
Studies on bariatric surgery included collectively 562 patients with a mean BMI ranging from 46 ± 8 to 53.62 ± 9.65 kg/m2. Baseline alterations in renal function included hyperfiltration [14, 15, 17, 20], pathological albuminuria [15, 17–20, 23, 25], proteinuria [16–18] or overt CKD [21, 22, 24, 26]. Two studies [21, 26] also included patients on haemodialysis (HD) treatment (see Table 3). In the studies by Serra [18], Agrawal [19], Serpa Neto [20] and Navaneethan [23], patients with abnormalities in renal function were only a minor proportion of the whole population but subpopulation analyses were not available. In the study by Mohan [25], we reviewed only the subpopulation with pathological albuminuria at baseline for which separate follow-up analyses have been performed. Schuster et al. [24] repeated measurement of renal parameters after weight loss in only 56 patients who had at baseline mild or moderate renal impairment. In the retrospective report by Mac Laughlin [26], eGFR and proteinuria were not numerically quantified, although the Authors described an improvement in these parameters 6 months after the surgical procedure. Wesley-Alexander et al. [21] reported a case series of nine patients who were an inception cohort of patients with improvement in renal function derived from a population of 45 obese patients undergoing surgery. There was heterogeneity in the type of surgery performed to achieve weight loss. In five studies [18–20, 24, 25], the surgical technique was Roux-en-Y gastric bypass, one study [23] considered Roux-en-Y or other types (undefined) of gastric surgery; in three studies [15, 17, 21], the technique used for gastric bypass/gastroplasty was not specified; in one case, weight loss was produced by intestinal bypass [14], laparoscopic sleeve gastrectomy [26] or bilio-pancreatic diversion [16] and, in one study [22], the type of bariatric surgery adopted was not detailed.
Effects of bariatric surgery on renal parameters
| Study | n | Baseline BMI/BW | Follow-up | Δ-BMI/Δ-BW | Δ-GFR | Δ-Creat (mg/dL) | ΔU-Alb (mg/24 h) | ΔU-Prot (g/24 h) |
|---|---|---|---|---|---|---|---|---|
| Brøchner-Mortensen et al. [14] | 25 | 136.4 kg | 12 months | −48.6 | −30.0 | −17.0a | – | – |
| Chagnac et al. [15] | 8 | 48.0 ± 2.4 kg/m2 | 12 months | −15.9 | −35.0 | – | −49.6b | – |
| Palomar et al. [16] | 35 | 46.9 ± 6.3 kg/m2 | 12 months | −14.0 | – | – | −10.3 | −0.53c |
| Navarro-Diaz et al. [17] | 61 | 53.62 ± 9.65 kg/m2 | 12 months 24 months | −19.9 −20.8 | −19.9 −21.5 | −8.26a −7.27a | −17.0 −19.2 | −0.03 −0.03 |
| Serra et al. [18] | 70 | 53.27 ± 79.58 kg/m2 | 12 months | −19.7 | −13.0 | – | −9.8 | −0.06 |
| Agrawal et al. [19] | 94 | 49.1 ± 8.0 kg/m2 | 12 months | −13.1 | – | −0.1d | −7.0e,f | – |
| Serpa Neto et al. [20] | 140 | 46.1 ± 5.4 kg/m2 | 8 months | −14.7 | −34.9 | – | −0.9 | −0.04 |
| Navaneethan et al. [22] | 25 | 49.8 kg/m2 | 6 months 12 months | −11.4 −15.3 | +8.7 +13.7 | −0.2 −0.3 | – | – |
| Navaneethan et al. [23] | 15 | 49 ± 9.0 kg/m2 | 6 months | −4.5 | – | −0.1 | −7.2e,f | – |
| Schuster et al. [24] | 46 | 50.7 ± 10.8 kg/m2 (n = 40; sCr 1.3–1.6) 53.1 ± 8.4 kg/m2 (n = 40; sCr > 1.6 mg/dL) | 24 months | NQ NQ | – | −0.2 +0.5 | – | – |
| Mohan et al. [25] | 15 | 44.3 ± 6.5 kg/m2 | Immediately after surgery | −4.9 | – | – | −62.5e | – |
aµmol/L.
bµg/min; NQ: not quantified.
cValue post weight-loss only semi-quantified (<200 mg/24 h).
dDecrease not significant.
eAlbumin to creatinine ratio (mg/g).
fDecrease not significant in the whole population (see text).
Bariatric surgery reduced BMI or body weight in all studies (Δ-BMI ranging from −4.5 to −20.8 kg/m2). The entity of BMI decrease was not quantified in the study by Schuster [24]. GFR decreased in four studies on obese patients with hyperfiltration [14, 15, 17, 20] and in another two [18, 26] where hyperfiltration was apparently not present (Δ ranging from −13.0 to −35 mL/min/m2). On the contrary, in the retrospective analysis by Navaneethan [22] including 25 obese patients with CKD Stage 3, eGFR increased after surgery from 47.9 to 56.6 mL/min/1.73 m2 at 6 months and 61.6 mL/min/1.73 m2 at 1 year. Creatinine decreased in the studies by Brøchner-Mortensen [14], Navarro-Diaz [17], Navaneethan [23], and in the case series of patients by Wesley-Alexander [8]. In the study by Schuster [24], creatinine decreased in patients with baseline mild renal impairment (sCr = 1.3–1.6 mg/dL) and increased in those with moderate renal impairment (sCr > 1.6 mg/dL). In the study by Agrawal [19], creatinine did not change but patients had normal values at baseline. Albuminuria (which was reported as 24-h urinary excretion, µg/min or mg/g creatinine) decreased in six studies [15–18, 20, 25]. Agrawal [19] described a significant reduction in albuminuria only in diabetic patients and in those with metabolic syndrome. In the study by Navaneethan [23], albuminuria significantly decreased only in patients with pre-existing microalbuminuria and in those undergoing Roux-en-Y gastric bypass. Proteinuria was reduced after surgery in all five studies in which the measurement was performed pre–post weight loss [16–18, 20, 26] (Δ ranging from −0.06 to −0.53 g/24 h).
Adverse effects reported
In the study by Palomar [16], surgery increased oxaluria without increasing the incidence of calcium stones but did not cause significant malnutrition or anaemia after 1 year. In the study by MacLaughling [26], during follow-up, one patient had myocardial infarction, one patient developed acute kidney injury due to severe dehydration and one patient had a compromised dialysis access. Furthermore, in one case, a gastric leak requiring further surgical intervention occurred after 7 months.
Diet (alone or combined with other interventions)
Studies on diet as intervention for weight loss included six prospective studies [27–32] and five RCTs [39–43], involving a total of 604 patients. Mean BMI ranged from 30.4 ± 5.3 to 47.6 ± 4.8 kg/m2. Pathological proteinuria [27–29, 31, 39, 41], albuminuria [27, 28, 30, 32, 40, 42, 43] or overt CKD [28, 29, 41, 43] were the main baseline alterations in renal function. One study [32] also included some patients with hyperfiltration. Diet was combined to lifestyle intervention in one study [30], to various programmes of physical exercise in three studies [31, 42, 43] and was the only intervention for weight loss in eight studies [27–29, 32, 39–41, 43]. The duration of the intervention ranged from 4 weeks to 24 months. In prospective studies, diet alone or combined to other interventions was effective in significantly reducing body weight or BMI in four studies [27–30]. In the studies by Shen [31] and Ezequiel [32], BMI decreased only in patients who met dietary prescriptions, while it did not change or even increased in ‘nonresponders’. eGFR and creatinine remained stable in the study by Gilardini [30] but patients had values approximately normal at baseline. Patients in the study by Solerte [28] had mild CKD at baseline and eGFR increased after weight loss from 66 ± 13 to 81 ± 11 mL/min/1.73 m2 (P < 0.01). An increase in eGFR, although not statistically significant, was also reported by Saiki [29]. eGFR decreased in the prospective study by Ezequiel [32] only in subjects responders to diet (from 121.4 ± 66.5 to 92.9 ± 38.6 mL/min/m2; P < 0.05). Of note, some of these patients were hyperfiltering. Proteinuria significantly decreased in three studies [27–29] (Δ ranging from −0.65 to −1.8 g/24 h) while, in the study by Shen [31], proteinuria was reduced by 51.3% only in responders. Diet improved albuminuria in two studies [27, 28] while, in the study by Ezequiel [32], albuminuria was reduced only in responders. The actual values of albuminuria were not provided by Gilardini et al. [30]; however, 8 of 17 obese microalbuminuric subjects became normoalbuminuric after 3 months of lifestyle intervention including periodic visits for education, advice reinforcement in dietary and exercise management.
In their RCT, Praga et al. [39] randomized 17 morbidly obese patients (mean BMI 37.9 ± 4.1 kg/m2) to hypocaloric diet (1000–1400 kCal/day) or captopril (25–150 mg/day) without dietary restriction. After 12 months, BMI decreased in diet group (37.1 ± 3 to 32.6 ± 3.2 kg/m2; P < 0.059) while renal function (measured either by eGFR or serum creatinine) remained unchanged in both groups. Proteinuria decreased in both diet (2.9 ± 1.7 to 0.4 ± 0.6 g/24 h; P < 0.05) and captopril (3.4 ± 1.7 to 0.7 ± 1g/24 h; P < 0.05) groups, and this reduction was significantly related to weight loss (r = 0.69; P < 0.05). Nicholson [40] randomized 11 diabetic microalbuminuric patients to low fat vegan- or standard-diet. After 12 weeks, the entity of weight loss was higher in the active group (7.2 versus 3.8 kg; P < 0.05); albuminuria decreased in the experimental group (438.8 ± 565.5 versus 155.2 ± 182.6 mg/24 h) and increased in control group (82.9 ± 114.6 versus 169.2 ± 298.0 mg/24 h), although in both cases not significantly. In the study by Morales [41], 30 obese patients with chronic diabetic or nondiabetic proteinuria (>1 g/24 h) and serum creatinine <2 mg/dL were randomized to a 500-kcal energy reduction diet or standard diet for 5 months. BMI significantly decreased in the intervention (33 ± 3.5 versus 31.6 ± 3.2 kg/m2; P < 0.01) and significantly increased in the control group (34.3 ± 5.7 versus 35 ± 5.8 kg/m2; P < 0.05). In the control group, serum creatinine increased from 1.6 ± 0.5 to 1.8 ± 0.6 mg/dL (P < 0.01) with a parallel reduction in eGFR (61.8 ± 22.1 versus 56 ± 19.9 mL/min/1.73 m2; P < 0.05) while renal function did not change in patients on diet. Proteinuria decreased significantly in the diet group (2.8 ± 1.4 versus 1.9 ± 1.4 g/24 h; P < 0.005) and tended to increase in the control group (3 ± 2.2 versus 3.5 ± 2.1 g/24 h; P = NS) (P < 0.05, difference between groups). As in the Praga study, the reduction in proteinuria was significantly associated to weight loss (r = 0.62; P < 0.01).
Seligman [42] randomized 75 nondiabetic obese subjects (some of them with microalbuminuria) to three different intervention programmes for 12 weeks: no-sugar diet and step counting exercise; no-sugar diet plus three-times a week fitness exercise; low-fat diet plus 1 h walking a day exercise. BMI, blood pressure and metabolic control improved in all groups. Albuminuria decreased in fitness [8.8 (1–52) versus 4.8 (1–46) mg/dL] and low-fat diet group (4.5 (1–90.1) versus 3.7 (1–90.1) mg/dL; P < 0.05 versus fitness group) while it tended to increase in step counting group. Finally, in their RCT, Straznicky et al. [43] enrolled 38 nondiabetic subjects including nonmorbidly obese (BMI <40 kg/m2) or overweight. An undefined percentage of them had microalbuminuria or CKD Stage 2 at baseline. Patients were randomized to caloric restriction, caloric restriction + aerobic exercise or standard care. After 12 weeks, BMI significantly decreased from baseline in caloric restriction (32.7 ± 0.9 versus 30.0 ± 0.9 kg/m2; P < 0.001) and caloric restriction + exercise group (31.9 ± 1.2 versus 28.5 ± 1.1 kg/m2; P < 0.001) while it remained stable in the control group. Albuminuria did not change in the control group while a significant decrease from baseline was observed in the caloric restriction (46 ± 31 versus 16 ± 8 mg/24 h; P = 0.01) and caloric restriction plus exercise-group (31 ± 4 versus 15 ± 5 mg/24 h; P = 0.01). eGFR and creatinine were unchanged in the control group while a significant improvement in kidney function was observed in the caloric restriction (creatinine 74.8 ± 4.1–67.5 ± 3.9 µmol/L; P < 0.05; eGFR 74.5 ± 4.0–83.4 ± 3.1 mL/min; P < 0.01) and caloric restriction plus exercise group (creatinine 75.2 ± 4.0–64.0 ± 4.1 µmol/L; P < 0.001; eGFR 76.6 ± 4.0–94.6 ± 5.5 mL/min; P < 0.001). No separate analyses were performed for obese or CKD subgroups.
Antiobesity drugs (alone or combined with other interventions)
Studies analysing the effects of weight loss induced by antiobesity drugs on renal parameters included one RCT of 541 patients on the effects of Topiramate [38], one non-RCT of 64 patients receiving Orlistat [36], three single-arm studies on Orlistat [33, 34, 37] and one on Metformin [35]. In all these studies, the mean BMI of subjects analysed ranged from 30.9 ± 0.8 to 36.4 ± 5.6 kg/m2. Baseline alterations in renal function included hyperfiltration [35], pathological albuminuria [33, 38] or overt CKD [34, 36, 37]. Two studies also included patients on HD treatment [36, 37]. In their RCT, Stenlof et al. [38] randomized microalbuminuric obese patients with newly diagnosed NIDDM to the antiobesity agent Topiramate at 96 mg/day (n = 180), 192 mg/day (n = 180) or placebo (n = 181). At baseline, mean body weight was 103.7 ± 16.9 kg and mean BMI 36 ± 4.5 kg/m2. No differences in albuminuria levels were reported at baseline between groups. Efficacy data were reported on a intention to treat basis for 229 patients. After 40 weeks of treatment, the placebo, the topiramate 96 mg/day and topiramate 192 mg/day groups lost 2.5, 6.6 and 9.1% of their baseline body weight, respectively (P < 0.001 versus placebo). The mean reduction in albuminuria from baseline was −16.19 with Topiramate 96 mg/day, −15.72 with Topiramate 192 mg/day and −1.01 mg/24 h with placebo (P < 0.01). In an open-label, prospective, controlled nonrandomized trial [36], Mac Laughling et al. studied 21 obese patients with CKD Stage 3–4 and 43 with CKD-5D. Forty-four patients were allocated to a 24-month weight-management programme consisting in a low-fat renal-specific diet, exercise and Orlistat (an inhibitor of fat absorption) at 120 mg/3 times/day. Twenty patients maintained on usual care served as controls. There were no differences in baseline mean body weight, BMI and eGFR between the two groups. After 8 months of intervention plus 18 months of follow-up, body weight achieved by the weight-management programme was lower than that achieved by the usual-care group (96.1 ± 16.1 versus 101.0 ± 26.8 kg; P < 0.001). Most weight loss occurred in the first 6 months during the intervention phase. eGFR (analysed only in patients with CKD Stages 3–4) decreased less in the weight-management programme group than in the usual-care group (Δ: −9.2 versus −20.7 mL/min; P < 0.001). Twelve subjects dropped out from the intervention group over 24 months. The combination of Orlistat therapy + hypocaloric diet and personalized exercise programme reduced BMI but also eGFR in two other prospective, uncontrolled studies [34, 37] considering collectively 167 obese CKD patients (of whom 30 were in HD treatment). Data from another prospective study [33] of 60 obese subjects, some with pathological albuminuria, showed that 6 months of Orlistat 120 mg/3 times/day without hypocaloric diet significantly reduced BMI in all participants and albuminuria only in nondiabetic patients [geometric mean (GM) 17.1–13.5 mg/24 h; P < 0.05]. However, these patients had baseline albuminuria levels significantly lower (GM 84.6 versus 17.1 mg/24 h; P < 0.001) and BMI values significantly higher (34.2 ± 4.7 versus 37.2 ± 6 kg/m2; P < 0.001) than diabetic patients. In a prospective, single-arm study [35], 38 nondiabetic, obese/overweight (mean BMI 30.9 ± 0.8 kg/m2) normoalbuminuric subjects, of whom 16 were hyperfiltering, undergone a structured weight loss programme including Metformin 500 mg one to three times daily, low calorie diet and aerobic exercise. The 12-month intervention reduced BMI (30.9 ± 0.8–27.6 ± 0.8 kg/m2; P < 0.001), eGFR (125 ± 11 to 114 ± 9 mL/min; P < 0.01) and albuminuria (9.9 ± 0.9–5.4 ± 0.3 mg/24 h; P < 0.001) in the whole population. However, no separate analyses focusing only on subjects with hyperfiltration or obesity (excluding overweight) were performed.
Adverse effects reported
Diarrhoea, fatty stools and flatulence were the most frequent adverse effects in patients receiving Orlistat [33, 34, 36]. Topiramate therapy was associated with a high incidence of neurological and psychiatric adverse effects [38].
Exercise alone
In one RCT [44], physical activity was the only intervention for achieving weight loss. This study randomized 13 obese (BMI >30 kg/m2) diabetic subjects, with CKD Stage 2–4 and persistent proteinuria to a supervised programme of home exercise or standard care. After 24 weeks, exercise training improved exercise duration during treadmill testing and produced a slight but insignificant decrease in 24-h proteinuria. However, no variations in eGFR, serum creatinine, albuminuria and even body weight were reported from baseline in both groups.
DISCUSSION
Results from this systematic review indicate that current evidence on renal effects of weight loss in CKD is mainly based on observational reports (low-grade evidence) and just a few randomized trials. Most studies analysed very small cohorts, were of low-to-moderate quality and included several potential sources of bias. In all studies considered, a significant reduction in BMI or body weight was registered, this reduction being more evident after bariatric surgery. Bariatric surgery is currently considered the most effective intervention to achieve long-lasting weight loss in morbidly obese subjects [45]. Bariatric procedures improve cardio-metabolic indices and ameliorate obesity-related comorbidities [46, 47]. In the studies analysed in this systematic review, bariatric surgery also produced a normalization of GFR in hyperfiltration [14, 15, 17, 18, 20] or normofiltration [34] patients and a significant GFR increase in patients with pre-existing mild CKD [22], suggesting a beneficial effect of weight loss on renal function. Similar observations were also reported in patients achieving weight loss by diet alone [28] or combined to metformin [35]. In other studies [29–31, 39, 41, 43], GFR remained stable in patients successfully achieving weight loss but tended to worsen in controls. In two studies focusing on patients with CKD [26, 36], some of which including Stage 5D CKD obese patients, the GFR was lower after lifestyle interventions or antiobesity drugs.
These different patterns of change in GFR could partly be explained by the different methods used to assess renal function (see in the ‘Study characteristics’ section). In obese patients, the estimation of GFR by common equations is significantly hampered by body size confounders and modified formulas have not yet been validated in this population [48].
In almost all the studies reviewed, weight loss significantly reduced proteinuria and/or albuminuria. Benefits of weight loss on albuminuria/proteinuria were particularly evident after bariatric surgery, in diabetic patients or in those with metabolic syndrome. In two very small RCTs testing a dietary intervention [40] or physical exercise [44], the change in albuminuria failed to achieve formal statistical significance while, in an uncontrolled study [33], albuminuria was significantly reduced after Orlistat therapy only in nondiabetic patients. Proteinuria and albuminuria are markers of renal damage but also predictors of cardiovascular outcomes in the general population [49] and, in obese patients, evidence exists that changes in weight parallel long-term changes in albuminuria in the general population [50–52]. In obese subjects, several mechanisms are implicated in proteinuria/albuminuria. Obesity mediates diabetes and hypertension and triggers glomerular hypertension by angiotensin II-dependent mechanisms [53]. Furthermore, CRP and adipokines like adiponectin and leptin, which influence podocyte biology [54], are markedly altered in obese subjects and show a clear tendency toward normalization after weight loss [18]. Blood pressure values were significantly reduced after weight loss in almost all the studies considered. Of note, evidence of a reduction in filtration fraction and in albuminuria were registered in eight severely obese patients after gastroplasty [15]. Several studies reported also significant improvements in lipid profile [28, 29, 31, 32, 37, 42], fasting glucose [23, 30, 40, 42], glycated haemoglobin [29, 38] and insulin levels or sensitivity [15, 18, 23, 30, 42] in association with the improvement in proteinuria or albuminuria, particularly in diabetics.
This review has some strengths including the systematic approach adopted and data extraction and data appraisal performed by two different reviewers. However, although comprehensive search strategies focused on a specific population (obese CKD patients) and intervention (weight loss) were implemented, conclusions are hampered by the fact that publication bias cannot be excluded. In order to capture as many reports as possible, we decided to adopt inclusive criteria, considering any paper including at least a subpopulation of obese patients with evidence of renal dysfunction and measurement of renal function pre- and post-weight loss. Yet, subgroup analyses according to CKD stage were not performed in most studies. There was a high heterogeneity in the number of subjects enrolled, severity of obesity and renal impairment, baseline nephropathy, presence of comorbidities, follow-up, type and duration of interventions and entity of weight loss, which prevented data pooling. For these reasons, we eventually adopted a systematic, narrative approach. Many questions remain unsolved. First, it still has to be ascertained whether the benefits of weight loss translates into better renal and CV outcomes in the long term. So far, no study has specifically been designed looking at kidney failure as end point. Furthermore, studies assessing whether weight loss in obese CKD patients might reduce fatal or nonfatal cardiovascular events, hospitalization rates and quality of life, independently from other comorbidities associated (e.g. diabetes, hypertension) are still lacking. There is a paucity of reports on the effect of weight loss in dialysis patients. In the present review, we found only three studies [21, 26, 37] including dialysis patients which represented a minor proportion of the source study cohort.
Obesity in dialysis patients is on the rise [55]. Severe obesity may pose surgical problems at the time of transplantation [56] and the so-called ‘obesity paradox’ will remain unresolved without proper clinical trials. This issue is important because studies focusing on metrics of abdominal obesity show that excess adiposity may reduce survival in dialysis patients [57]. In conclusion, although weight loss seems to produce renal benefits in obese CKD patients, current evidence is still sparse and limited, which prevents definitive conclusions for recommending specific interventions in the CKD population. Future, high-quality studies focusing on hard outcomes such as CKD progression or kidney failure are needed to clarify whether intentional weight loss offers additional benefits to the renal, as well as the cardiovascular risk profile in the long term.
CONFLICT OF INTEREST STATEMENT
None declared.


Comments