Article Text

Statistics from Altmetric.com
Description
A 30-year-old man presented with gradually progressive spasticity of all limbs and dementia for 1 month. A CT scan showed extensive symmetric calcifications involving subcortical white matter of the cerebrum and cerebellum (figure 1), bilateral basal ganglia, thalamus (figure 2) and dentate nucleus (figure 3). An MRI showed the calcifications as T1 hyperintensities and gradient hypointensities. The T2 and fluid-attenuated inversion recovery (FLAIR) images showed ill-defined hyperintense foci in bilateral centrum semiovale (figure 1). MR spectroscopy showed no lactate peak. Blood investigations revealed normal serum levels of calcium, phosphorus and parathyroid hormone. Initial and secondary blood and urine screening showed no evidence of mitochondrial disease.

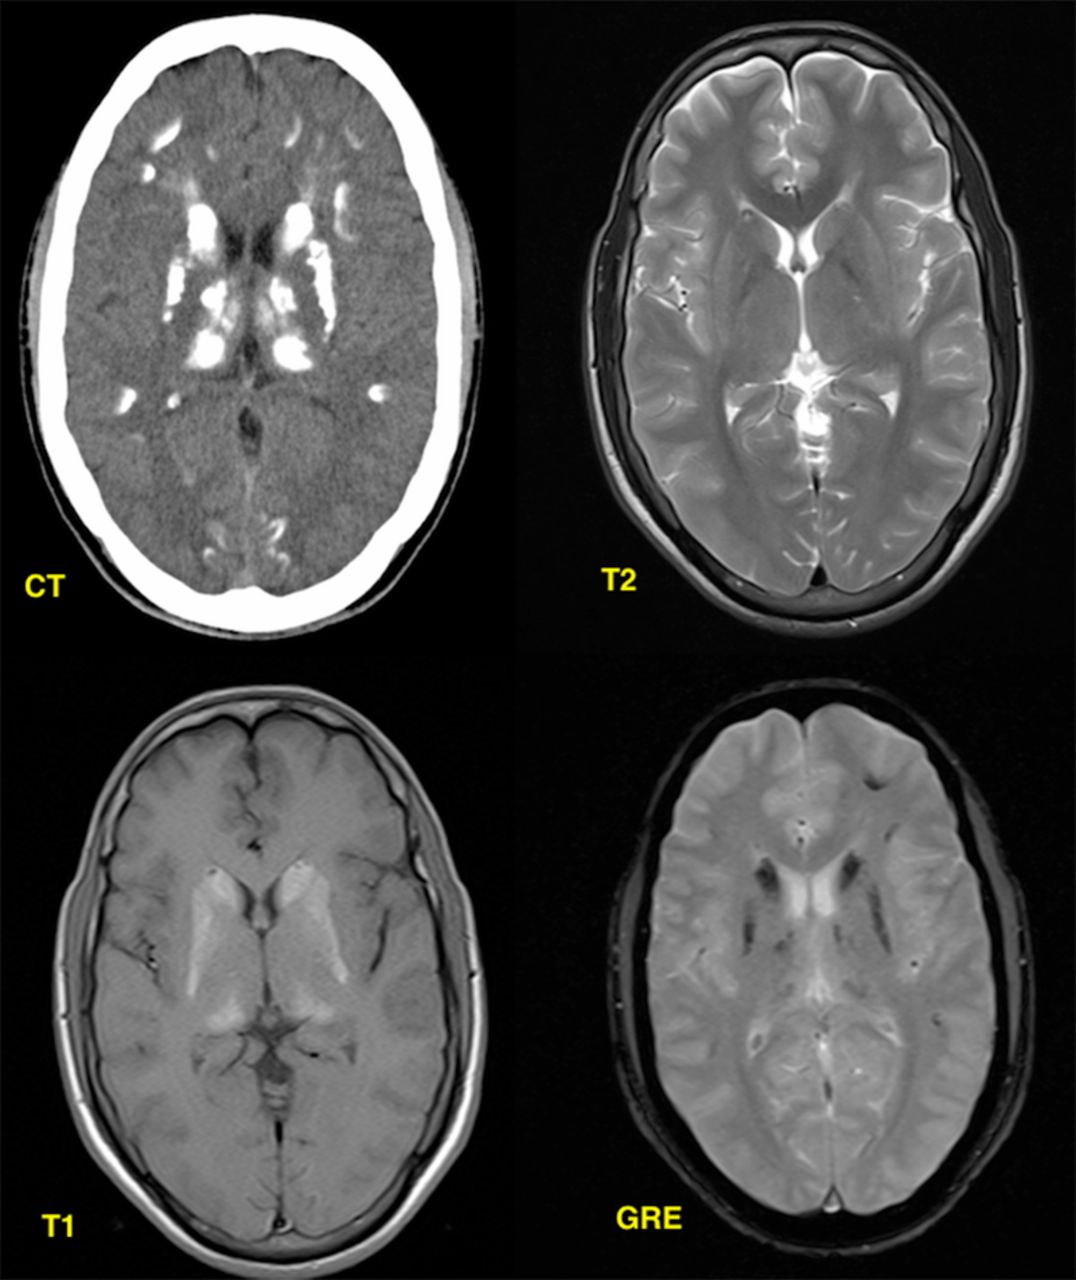
Images at the level of centrum semiovale. A CT scan showing subcortical white matter calcifications, T2 shows ill-defined hyperintensity in bilateral centrum semiovale, T1 showing no changes and Gradient (GRE) showing subcortical hypointensities, but in lesser areas than CT.

Images at the level of basal ganglia. CT shows extensive calcification of bilateral basal ganglia and thalami, T2 showing no evidence of calcification, T1 (C) and Gradient (GRE) images showing calcification of bilateral basal ganglia and thalami, but to a lesser extent than CT.

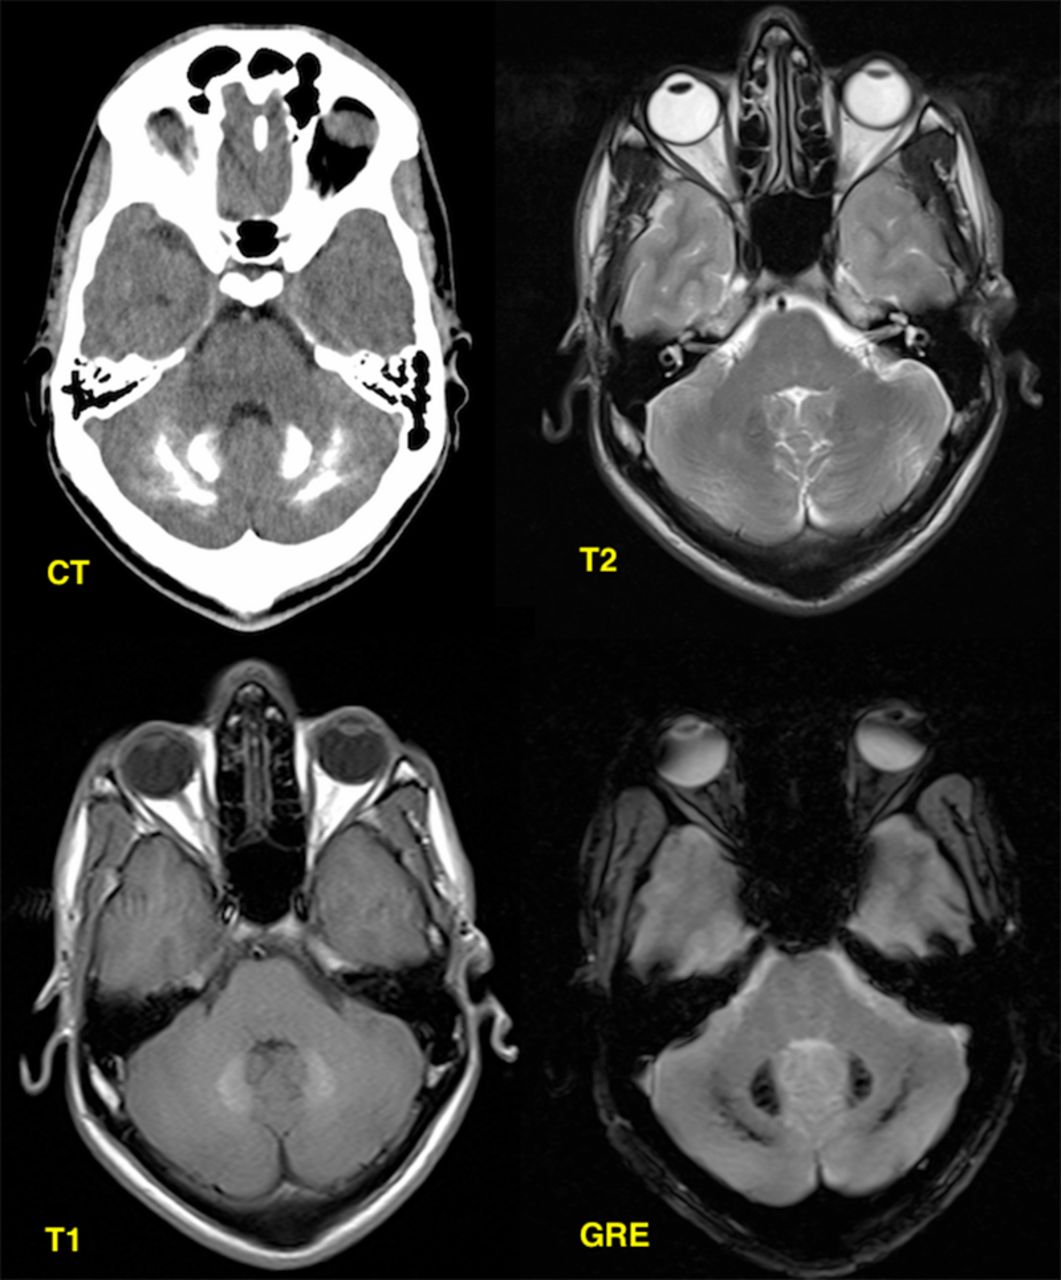
Images at the level of cerebellum. CT shows calcification of bilateral dentate nuclei and cerebellum, T2 showing no changes, T1 shows only dentate nuclei calcification and Gradient (GRE) showing calcifications but to a lesser extent than CT.
The diagnostic criteria for Fahr’disease is1
-
Bilateral calcification of the basal ganglia;
-
Progressive neurological dysfunction;
-
Age of onset is typically fourth or fifth decade, may present earlier in life;
-
Absence of biochemical and somatic features suggestive of a mitochondrial or metabolic disease;
-
Absence of an infectious, toxic, or traumatic cause;
-
Family history.
This patient satisfied the first five criteria and was diagnosed with Fahr's disease.
In MRI, most of the calcific foci were underestimated and some were undetected. But T2 and FLAIR images showed hyperintensities in the bilateral centrum semiovale (which were not seen in CT), which correlates well with the clinical features. These hyperintensities could represent a subacute metabolic or inflammatory process, which may calcify in due course.2
In conclusion, calcifications are better demonstrated in the CT scan but the MRI changes correlate better with the clinical symptoms and is thus more constructive.
Learning points
-
Symmetric calcifications in the bilateral basal ganglia, thalamus, dentate nuclei and subcortical white matter of cerebrum in the presence of a normal calcium-phosphorus metabolism often suggests Fahr's disease.
-
A CT scan is better for depiction of the calcifications, but MRI shows the inflammatory or metabolic process, which is yet to be calcified and thus will better explain the patient's present symptoms.
Footnotes
-
Contributors AG participated in collection of data and investigation studies, reviewed scientific literature and drafting of the manuscript.
-
Competing interests None.
-
Patient consent Obtained.
-
Provenance and peer review Not commissioned; externally peer reviewed.