Article Text

Statistics from Altmetric.com
Description
A 60-year-old male diabetic patient with a history of chronic renal disease and regular haemodialysis for 6 years presented with altered sensorium, since 3 days. On examination, the patient was afebrile; his pulse rate was 78 beats/min; his blood pressure was 130/80 mm Hg, and he was tachypneic with a respiratory rate of 30 breaths/min. On neurological examination, the patient was conscious with a Glasgow Coma Scale score of E4M5V2, upper limb rigidity and slurred speech; extensor plantar reflex, hypertonia and exaggerated reflexes were noted; and cranial nerve examination was normal with no focal neurological deficits. Laboratory blood investigations done showed haemoglobin 141 g/L red blood cell 5.1 x 10¹²/L total white blood cels 6.6 x 10⁹/L /, platelet count 270 x 109 /L, absolute neutrophil count 4790 cells/mm3, absolute lymphocyte count 1600 cells/mm3, absolute eosinophil count 210 cells/mm3, serum sodium 140 mEq/L, serum chloride 102 mEq/L, serum potassium 4.5 mEq/L, serum calcium 9.2 mg/dL, total bilirubin 0.8 mg/dL, serum alanine aminotransferase 18 IU/L, serum aspartate aminotransferase 29 IU/L and serum alkaline phosphatase 110 IU/L. Recorded random blood sugar (RBS) at admission was 318 mg%, serum ketone levels 3.5 mEq/L, with urine ketone bodies of 2+ and glycated haemoglobin of 9.1%. Blood analysis revealed high levels of Blood urea (84 mg/dL) and high levels of serum creatinine (4.3 mg/dL) with metabolic acidosis (pH 6.9, HCO3: 10.1 mmol/L). The patient had poor diabetic control and impaired renal function tests as his dialysis schedule was postponed due to the local prevailing pandemic situation.
CT scan showed symmetrical hypodensities in the bilateral basal ganglia (figure 1).
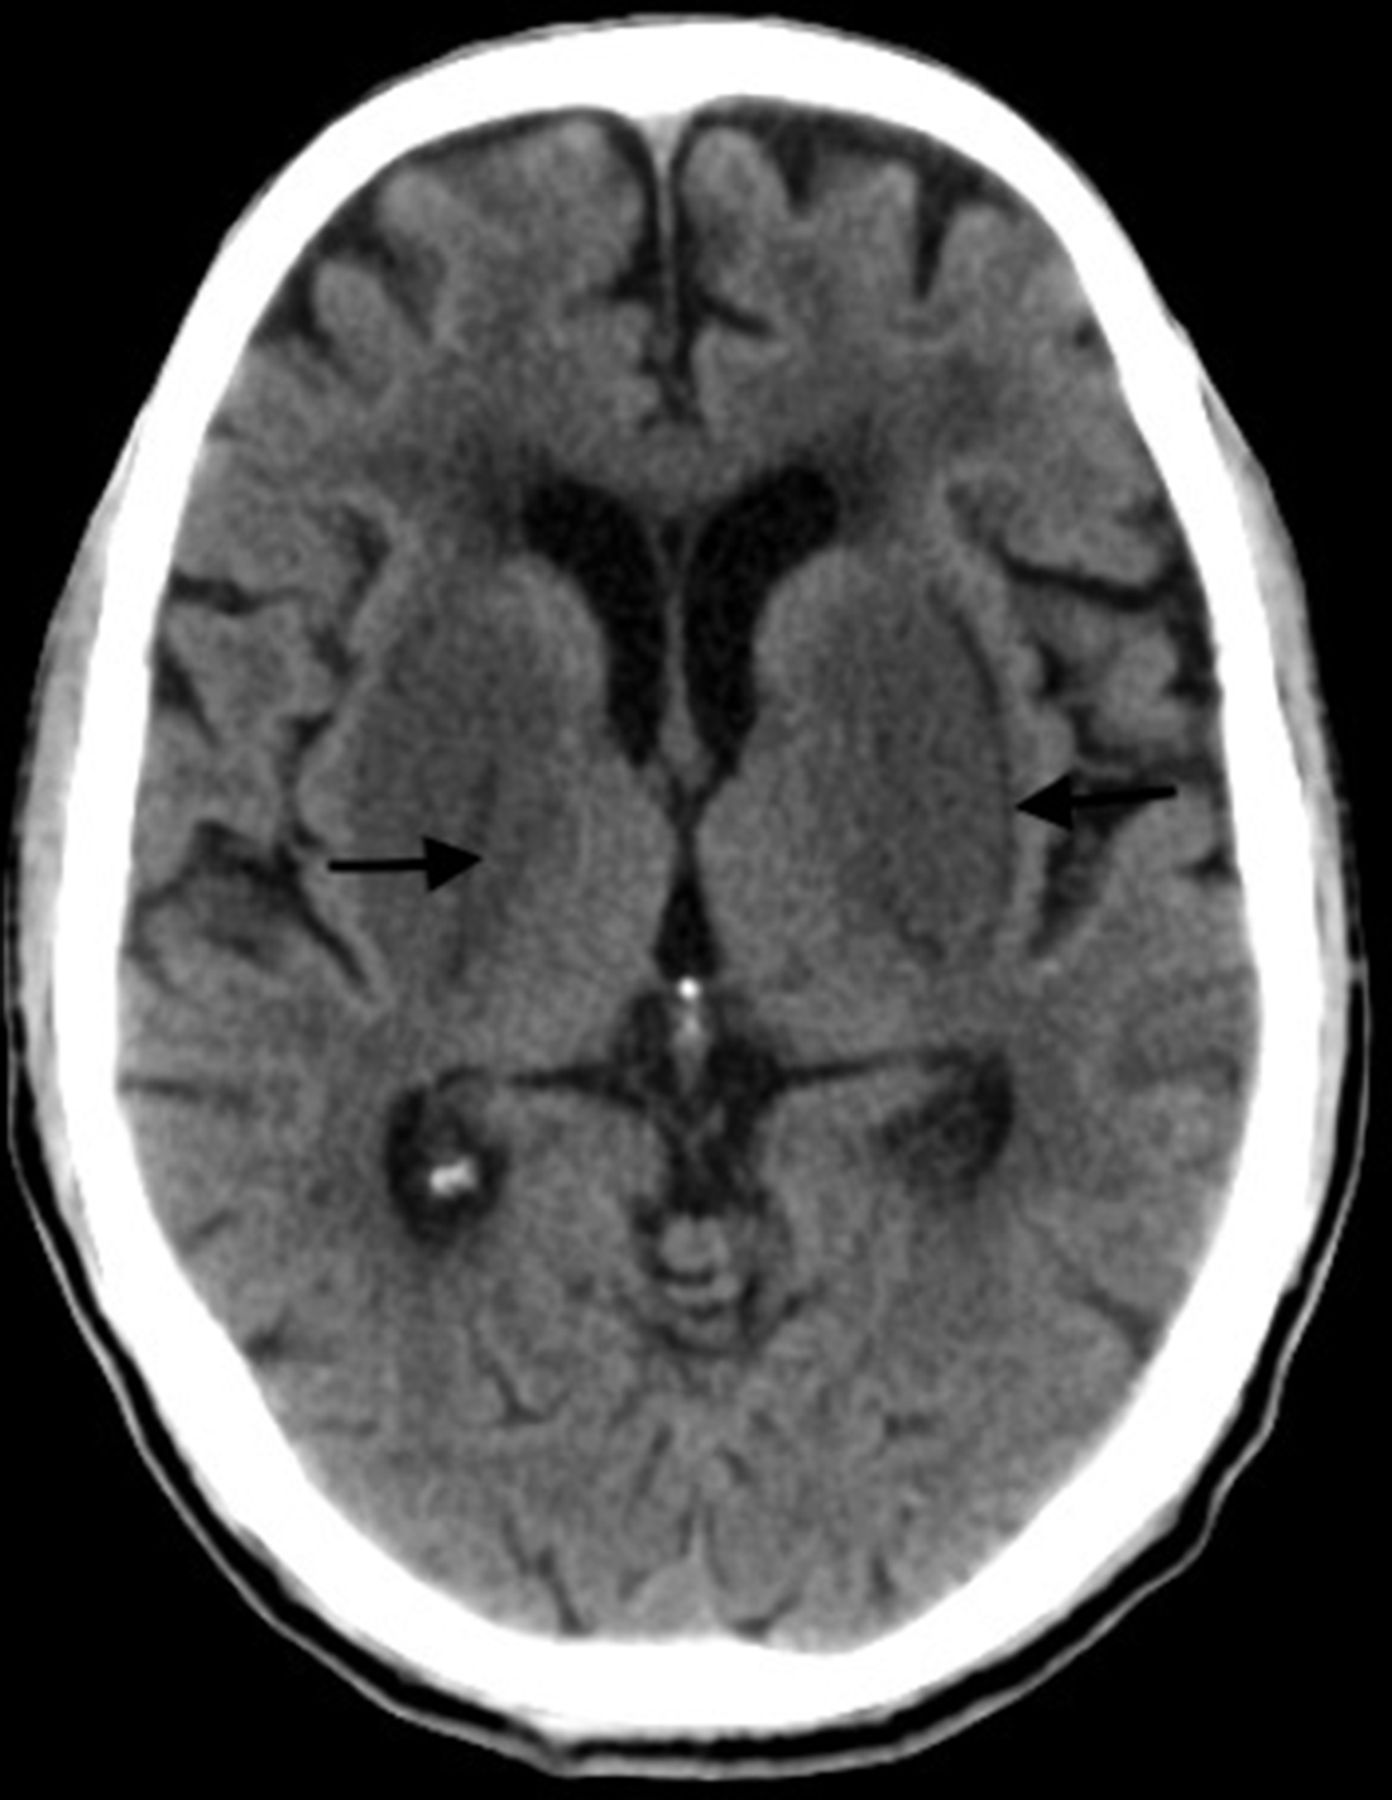
CT of the brain showing bilateral symmetrical hypodensities (arrow) in the basal ganglia.
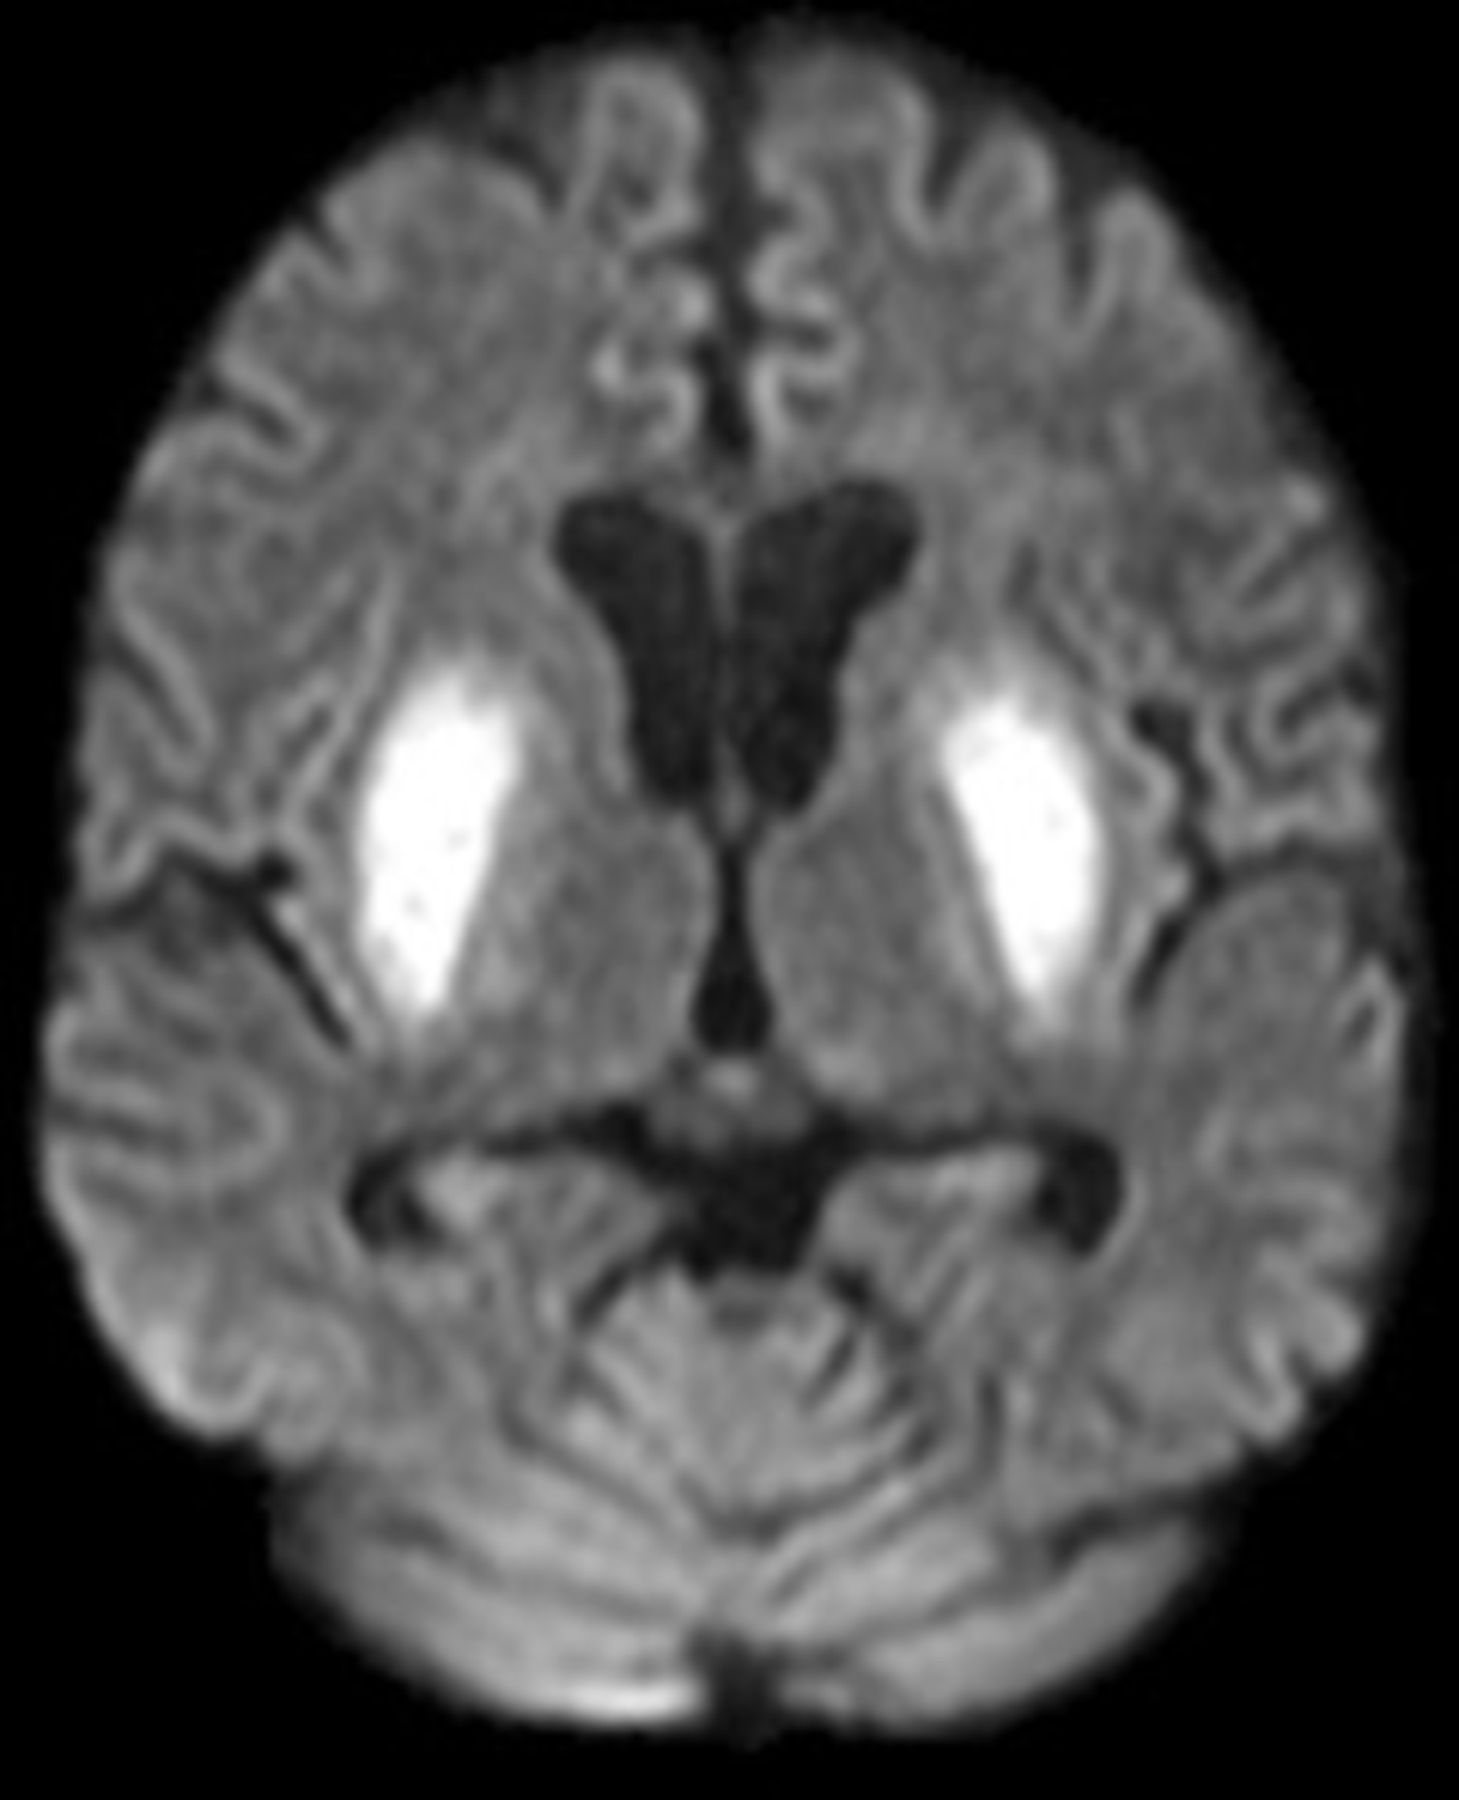
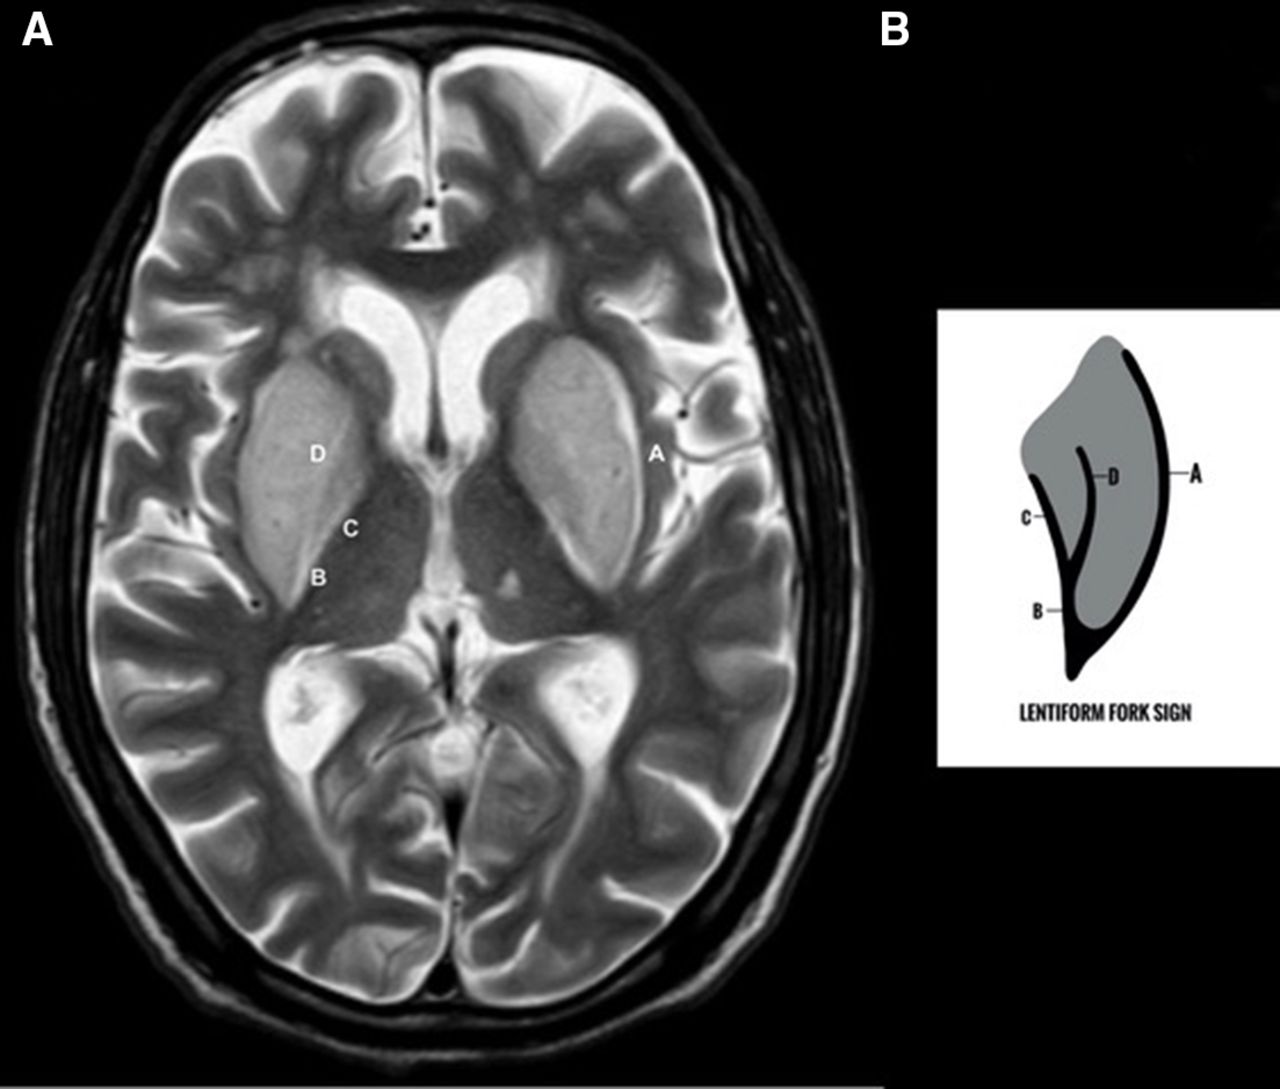
Brain MRI showed symmetrical T2-weighted (T2W) imaging hyperintensities in bilateral basal ganglia with a typical fork-like appearance (figure 2A,B) and with restriction on diffusion-weighted imaging (figure 3).

(A) Axial T2-weighted image of the brain showing symmetrical hyperintensity in the bilateral basal ganglia with LFS. (B) Schematic diagram representing the LFS. A, external capsule; B, internal capsule; C, internal medullary lamina; D, external medullary lamina; LFS, lentiform fork sign.
Axial Diffusion weighted image of the brain showing diffusion restriction in the bilateral basal ganglia.
Glycaemic status was managed by regular intravenous insulin infusion of 5 units/hour stat with tapered dose and followed by subcutaneous regular insulin 8 units three times per day, along with optimisation of haemodialysis with correction of acidosis. The patient’s neurological symptoms gradually improved and he was discharged after 2 weeks. He was further counselled for regular glycaemic control and regular haemodialysis (three times per week).
On follow-up with the neurological clinic after 2 months, the neurological examination was normal and symptoms completely resolved. Follow-up scan was not done.
Uraemic encephalopathy (UE) is a neurological complication that may result from multiple disorders associated with acute or chronic renal failure.1 It is characterised by acute or subacute onset of reversible neurological symptoms.
Diabetes mellitus makes the basal ganglia more vulnerable to uraemic toxins because of endothelial dysfunction in cerebral vessels, and uraemic toxin inhibits mitochondrial function with destruction of the pallidum and putamen. Further metababolic acidosis associated with renal failure or uncontrolled diabetes is presumed to accelerate this process and cause pallidal and putaminal necrosis and damage.
Lentiform fork sign (LFS): The white matter surrounding the basal ganglia, the internal and external capsules with hyperintense basal ganglia on T2W and Fluid attenuated inversion recovery and necrosis in the putamina gives the typical fork appearance. The linear hyperintense signal on T2W and FLAIR images in the external capsule represent the lateral prong of the fork, and the hyperintense signal of the external and internal medullary laminae combine to form the internal capsule, which represents the medial prong of the fork which together fuse to form the stem of the fork.2 On diffusion MRI, restriction may be noted within the hyperintensity with reduced Apparent Diffusion Coefficient possibly implying cytotoxic injury.3
Causes of lentiform fork sign include various metabolic and toxic derangements such as UE; diabetes mellitus; drug-induced including metformin, methanol or ethanol poisoning; propionic and other organic acidemias; and pyruvate dehydrogenase deficiency, which lead to secondary metabolic acidosis.
Metabolic acidosis secondary to the renal failure with poor diabetic control and ketosis are the frequent predisposing factors that lead to UE with classical appearance of ‘lentiform fork sign’ as seen in our case.
Correction of metabolic acidosis with prompt optimised scheduled dialysis and diabetes control is an essential part of treatment in these patients.
Patient’s perspective
After admission and treatment, my symptoms have improved and am feeling better. The dialysis services provided were satisfactory and am now having regular scheduled dialysis. I was counselled on the ways to undergo my scheduled dialysis and to approach the hospital authorities in cases of an unprecedented pandemic situation. I was also counselled on the need for regular glycaemic control. I am also happy to know that my clinical emergency is being published so it would help other patients.
Learning points
Lentiform fork sign occurs due to metabolic acidosis associated with patients with diabetes and renal failure with poor dialysis and glycaemic control leading to reversible basal ganglia and adjacent white matter injury.
Correction of metabolic acidosis with prompt dialysis and glycaemic control is an essential part of treatment in these patients.
Ethics statements
Patient consent for publication
Footnotes
Contributors RKN is the sole contributor of the work submitted who did planning, conducting and reporting of the work.
Funding The authors have not declared a specific grant for this research from any funding agency in the public, commercial or not-for-profit sectors.
Competing interests None declared.
Provenance and peer review Not commissioned; externally peer reviewed.