Article Text

Statistics from Altmetric.com
Description
An 11-month-old, developmentally normal, female infant presented with acute-onset fever, vomiting, shallow breathing and gradually progressive lethargy for the past 2 days. There was no history of seizures, neck stiffness, focal motor deficits, cranial nerve palsies, tone changes, rash, diarrhoea, recurrent encephalopathies, abnormal body odour, recurrent infections or hospitalisations, drug or toxin ingestion. Her past and family history was not contributory. On examination, anthropometric parameters were normal for age. She had mild pallor, angular cheilitis, wrist widening, tachypnea (respiratory rate 58/min) with acidotic breathing. She was conscious with fluctuations in alertness (Glasgow Coma Scale (GCS) E4M5V2) and irritability with reduced spontaneous activity, mild hypotonia, preserved antigravity movements, brisk muscle stretch reflexes, bilateral extensor plantar response, absence of oculomotor abnormalities, cranial nerve palsies or bulbar signs and normal fundi. Rest of the systemic examination was unremarkable. A clinical diagnosis of acute febrile encephalopathy was considered.
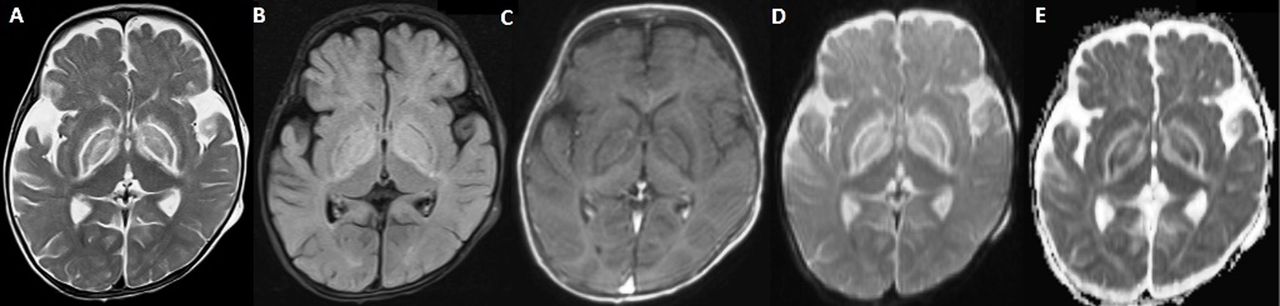
Laboratory investigations showed haemoglobin 85 g/L, platelets 86 000 cells/µL (range 150 000–400 000), total leucocyte count 9500 cells/µL (range 4000–11 000) (neutrophils 51%, lymphocytes 41%, monocytes 7% and eosinophils 1%), serum sodium 146 meq/L, potassium 4 meq/L, urea 36 mg/dL, creatinine 0.9 mg/dL, C reactive protein 56 mg/dL (normal below 8 mg/dL), B12132 pg/mL (range 211–911), homocysteine 3.86 μmol/L (range 5–15), pH 7.21, serial lactate values 4.5 and 1.4 mmol/L (normal <2), ammonia 80 μmol/L and normal anion gap. Blood glucose records were normal throughout the hospital stay. Cerebrospinal fluid analysis showed no cells, glucose 149 mg/dL and protein 152 mg/dL. Blood, urine and cerebrospinal fluid cultures were sterile. MRI of the brain showed bilateral basal ganglia involvement with characteristic lentiform fork sign and a lactate peak on magnetic resonance spectroscopy (figure 1A–E). Urine analysis did not reveal any reducing substances, methyl malonic acid metabolites, sulfites, glycosaminoglycans or ketones. Tandem mass spectroscopy/gas chromatography was normal. Metabolic acidosis gradually improved with supportive treatment and recovery from febrile illness, and she was discharged after 2 weeks. Follow-up evaluation after 2 months showed mild bradykinesia on neurological examination, and repeat brain MRI revealed remarkable resolution of previously reported lesions.

MRI of the brain (A) T2 and (B) FLAIR axial sections showing bilateral hyperintensities in lentiform nuclei (putamen and globus pallidus) and posterior limb of internal capsule with sparing of ventrolateral thalami and the perirolandic white-matter and a brightly hyperintense rim surrounding the globus pallid giving the classic ‘fork-like’ bright appearance on T2-weighted image. Subtle hyperintensities are also seen in the periventricular and occipital white-matter. These areas are hypointense on FLAIR (B) and (C) non-contrast T1-weighted axial image. (D) Diffusion-weighted image shows diffusion restriction in bilateral lentiform nuclei and forks (E) Corresponding apparent diffusion coefficient (ADC) map shows low signal intensity in bilateral lentiform nuclei and high signal intensities of both the forks. Magnetic resonance spectroscopy showed a lactate peak (not shown). The overall MRI picture is consistent with metabolic encephalopathy.
We describe a case of acute metabolic acidosis associated with acute febrile encephalopathy, bilateral basal ganglia involvement and characteristic lentiform fork sign. The cause for metabolic acidosis was probably recurrent vomiting for the past 2 days associated with poor intake and lethargy. Underlying infection or overwhelming sepsis was also a contributory factor to the initial acidosis. Severe metabolic acidosis, with or without hypoxia and ischaemia, leads to changes in the cerebral microvascular anatomy and blood-brain barrier. These result in vasogenic oedema seen as the bright lentiform fork due to the differential metabolic vulnerability of neurons and astrocytes and may progress to cytotoxic oedema often seen as bilateral putaminal necrosis in severe cases.1 ‘Lentiform fork sign’ on MRI is a distinctive neuroradiological sign characterised by a bright hyperintense rim delineating the lentiform nucleus as a fork.2 It is commonly seen in uremic encephalopathy, diabetes mellitus, methanol and ethylene glycol intoxications, organic acidaemia and pyruvate dehydrogenase deficiency, and underlying metabolic acidosis is the proposed common trigger. In the absence of an underlying systemic disease and life-threatening clinical presentation, the prognosis is generally good as seen in the index case.
Learning points
Lentiform fork sign on MRI is a distinctive neuroradiological sign.
Common associated conditions include uremic encephalopathy, diabetes mellitus, methanol and ethylene glycol intoxications, organic acidaemia and pyruvate dehydrogenase deficiency.
Underlying severe metabolic acidosis, with or without hypoxia and ischaemia, is the common trigger.
Footnotes
Contributors AGS: draft of the manuscript and revision. SKS: draft of the manuscript and revision. PSingh: radiological interpretation of results and revision. PSinghi: clinician in charge, final revision and approval.
Competing interests None declared.
Patient consent Guardian consent obtained.
Provenance and peer review Not commissioned; externally peer reviewed.